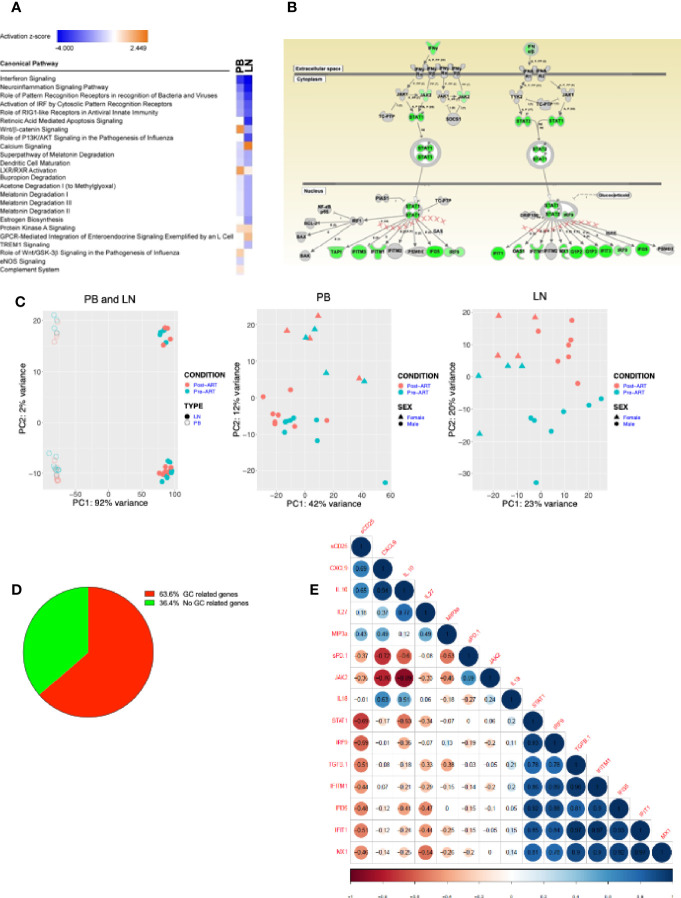
Figure 7.
Transcriptional profiling on samples from PB and LN. (A) RNAseq of HIV+ participant longitudinal samples from PB (n = 12) and LN (n = 11). Differentially expressed genes pre/post ART filtered by a fold change of 1.3, then analyzed by Ingenuity pathway analysis (IPA). Listed are the most significantly enriched pathways. (B) Depiction of Type I/II interferon signaling pathway, the most enriched pathway in both PB and LN; green indicates genes significantly downregulated post-ART. (C) Principal component analysis (PCA) distinguishing PB (open) and LN (closed) compartments and pre- (green) and post- (red) ART time-points (left panel); PB (middle) and LN (right) panels distinguishing pre- (green) and post- (red) ART time-points and gender: female (triangle) and male (circle). (D) Pie chart of LN samples showing percentage of HIV+ participant samples with GC-related and non-GC-related genes that underwent a 1.3-fold or more change post-versus pre- ART. (E) Correlation matrix of fold changes of plasma biomarkers versus normalized transcripts of interferon related genes (n = 10).

