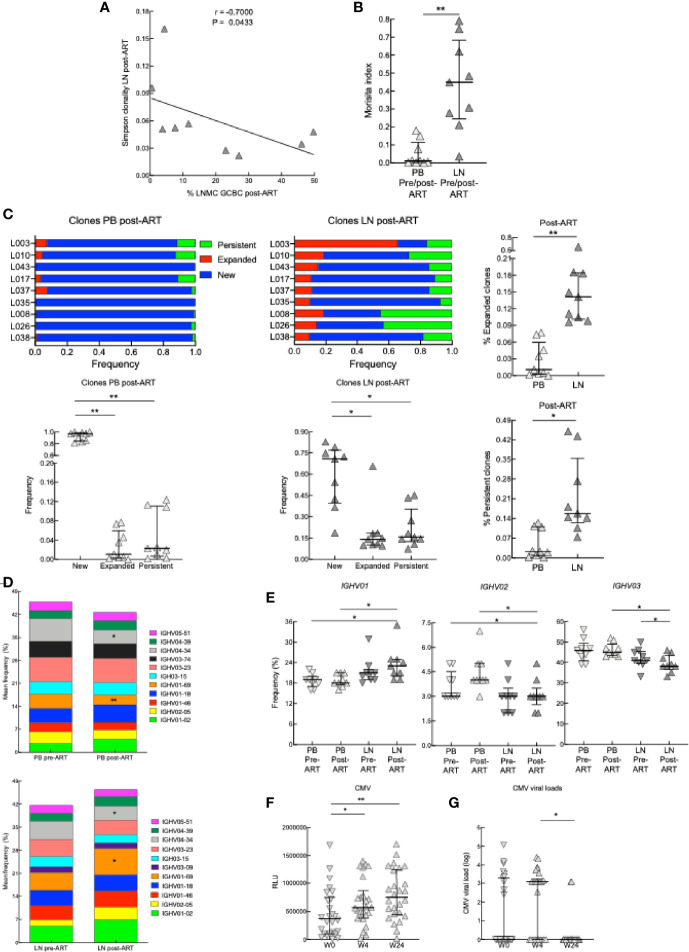
Figure 8.
BCR sequencing on samples from PB and LN. (A) Correlation between Simpson clonality in LN post-ART and the frequency of GCBC post-ART of nine HIV+ pre- and post-ART participants. *p < 0.05 by Spearman’s rank correlation. (B) Morisita index determined for PB and LN samples of nine HIV+ pre- and post-ART participants. (C) Ig heavy chain clone frequencies for nine HIV+ participants, depicted and compared at post-ART by categories defined relative to pre-ART: new for clones not previously present, expanded for clones that increased 2-fold and persistent for clones that did not change in frequency. (D) Stacked bar graphs showing the average frequency of the top 11 IGVH gene families present in PB and LN of nine HIV+ pre- and post-ART participants. (E) Frequencies of IGHV01, IGHV02 and IGHV03 families in the PB and LN of nine HIV+ pre- and post-ART participants. (F) Serum CMV antibody titers at week 0, week 4, or week 24 (n = 26). (G) CMV viral loads of 26 HIV+ at week 0, 4 or 24. *p < 0.05, **p < 0.01 by Wilcoxon signed rank test after obtaining significance by Friedman test on full set (C, E); data are not statistically significant unless noted.

