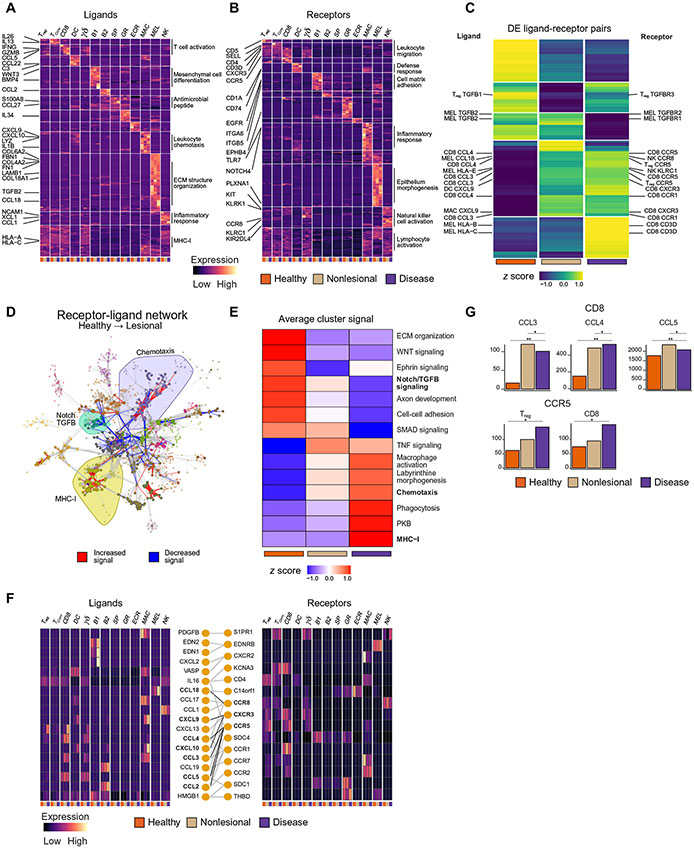
Fig. 4: Ligand receptor mapping establishes communications between cells and their change in vitiligo.
K-means clustering of all expressed ligands (A) and receptors (B) across each cell type and each skin condition, as annotated by a published database with representative GO terms for each k group. Each box represents the aggregate bulk CPM value for a given gene expressed in that cell type in each condition. K-means clustering of all ligand-receptor pairs in which at least one of the genes is significantly (p < 1.0E−2) DE (C). Plot of the full receptor and ligand network showing the 18 identified clusters within the network, with the Chemotaxis, TGFB / Notch Signaling, and MHC-I clusters highlighted. Edge color denotes whether the given interaction is increased or decreased in signal between healthy and lesional skin (D). K-means clustering of the meta-edges of each cluster within the network across each of the skin conditions (E). Chemokine network heatmaps showing the expression of ligands and receptors, as well as their annotated interactions (F). Barplots showing CCL3/4/5 expression within CD8+ T cells and CCR5 expression on Tregs and CD8+ T cells (G)

