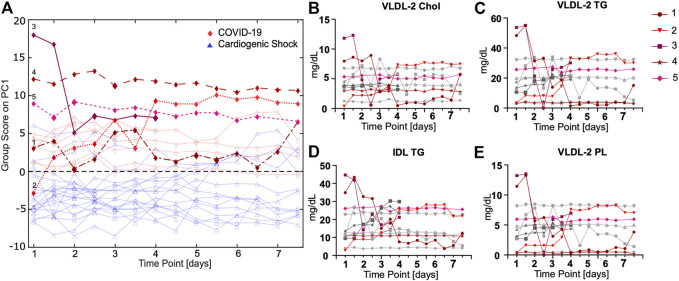
FIGURE 5.
(A) ASCA analysis of COVID-19 (red) vs. CS (blue) samples shows a separation between groups in consideration of different groups and time points. (B–E) Time courses of lipoproteins measured twice a day for COVID-19 patients that are only significant for comparison of COVID-19 vs. CS show striking progressions over time for some patients (highlighted in red).

