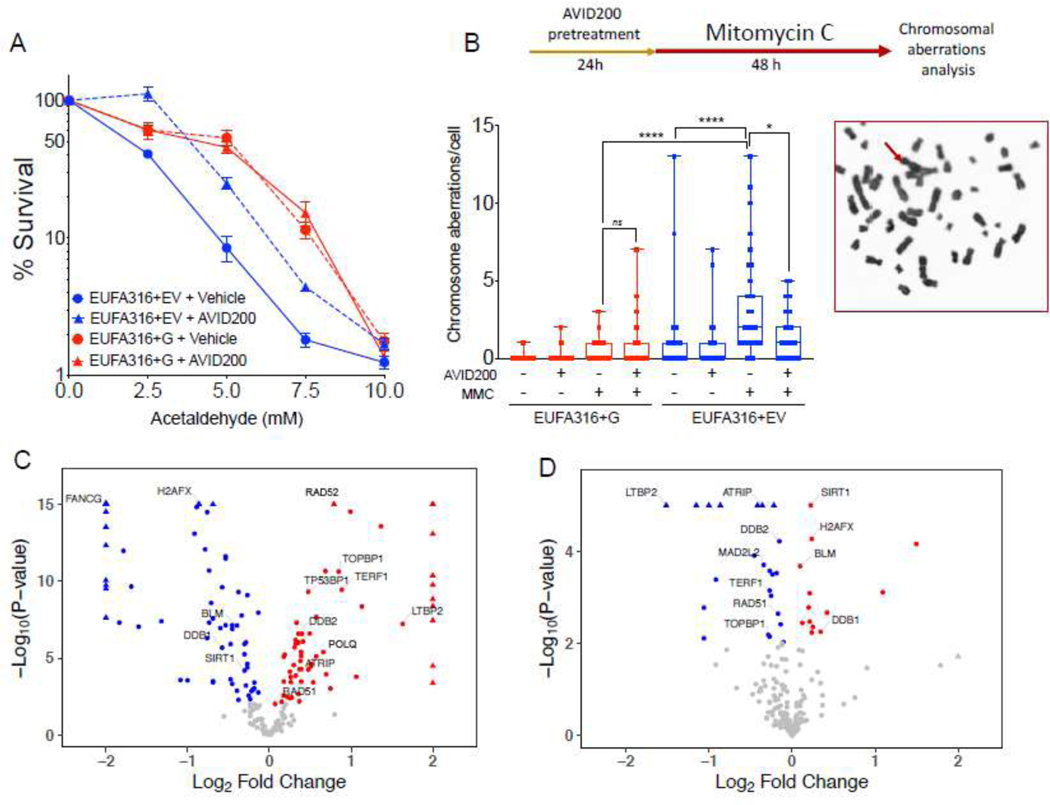
Figure 4. Inhibition of the TGFβ pathway with AVID200 rescues genotoxicity in FA-derived human cell lines.
A) AVID200 improves the survival of FANCG-deficient human FA lymphoblast cells in presence of acetaldehyde. FANCG-deficient parental cells (EUFA316+EV) and FANCG-corrected cells (EUFA316+FANCG) were exposed to graded concentration of acetaldehyde and AVID200 (0.2 ng/mL) for 6 days and survival was determined by CellTiter Glo reagent (n=12 per condition).
B) AVID200 pretreatment reduces the frequency of Mitomycin C (MMC)-induced chromosomal aberrations in FANCG-deficient cells. EUFA316+EV cells and EUFA316+FANCG cells were pre-treated with AVID200 before exposure to MMC and metaphase spreads of the chromosomes were scored for chromosomal aberrations. Quantification of the MMC-induced chromosomal aberrations is shown in the left panel (n=3). A representative metaphase from the EUFA316+EV cell line treated with MMC is shown in the right panel, red arrow indicates a radial figure.
C) Volcano plot showing DNA repair-related differentially expressed genes of the FANCG-deficient cell line (EUFA316+EV) relative to the FANCG-corrected cell line (EUFA316+FANCG). The log fold change in the EUFA316+EV cell line versus the EUFA316+G cell line is represented on the x-axis. The y-axis shows the Log10 of the p value. Downregulated genes with a p value of 0.05 are indicated in blue, whereas upregulated genes with a p value of 0.05 are indicated in red (n=3).
D) Volcano plot showing DNA repair-related differentially expressed genes of the FANCG-deficient cell line (EUFA316+EV) after 24 h exposure to AVID200 (0.2 ng/mL). The log fold change in the EUFA316+EV + AVID200 cell line versus the untreated cell line is represented on the x-axis. The y-axis shows the Log10 of the p value. Downregulated genes with a p value of 0.05 are indicated in blue, whereas upregulated genes with a p value of 0.05 are indicated in red (n=3).
p-values of 0.01 to 0.05 were considered significant (*), p-values of 0.001 to 0.01 were considered very significant (**) and p-values of <0.001 were considered extremely significant (***, ****). Data in (A) are represented as mean ± SEM, data in (B) are presented as boxplot, data in (C) and (D) are presented as volcano plots. See also Supplementary Figure 4.

