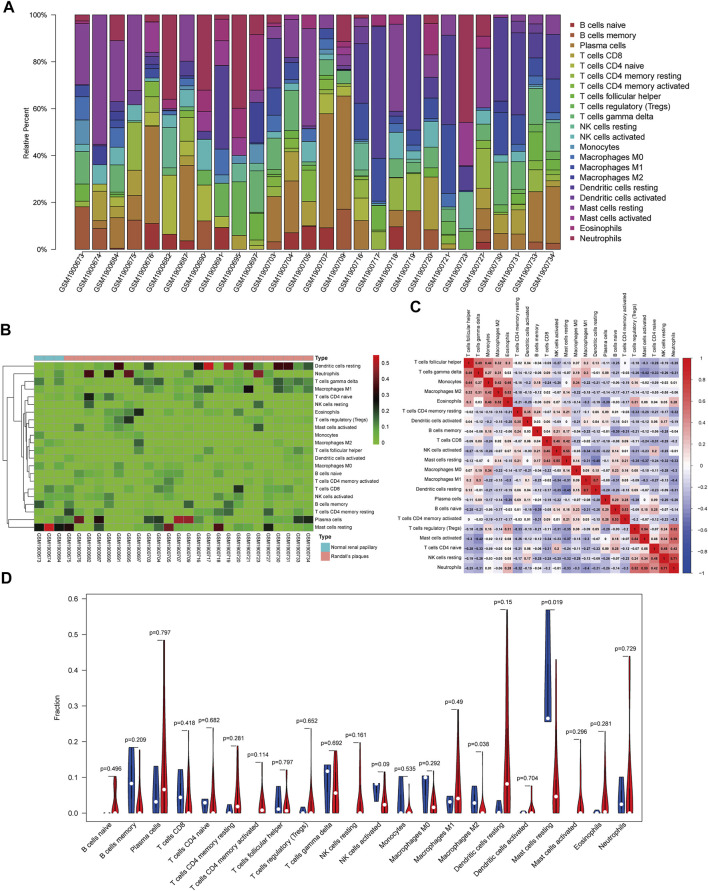
FIGURE 5.
Composition of infiltrating immune cells assessed using the CIBERSORT algorithm in kidney tissues. (A) Distribution of immune cell infiltration in each sample. (B) Heatmap of immune cell types. (C) The correlation among infiltrating immune cells. (D) Violin plot of infiltrating immune cells.

