
Figure 3. Barcode reading using deep learning models.
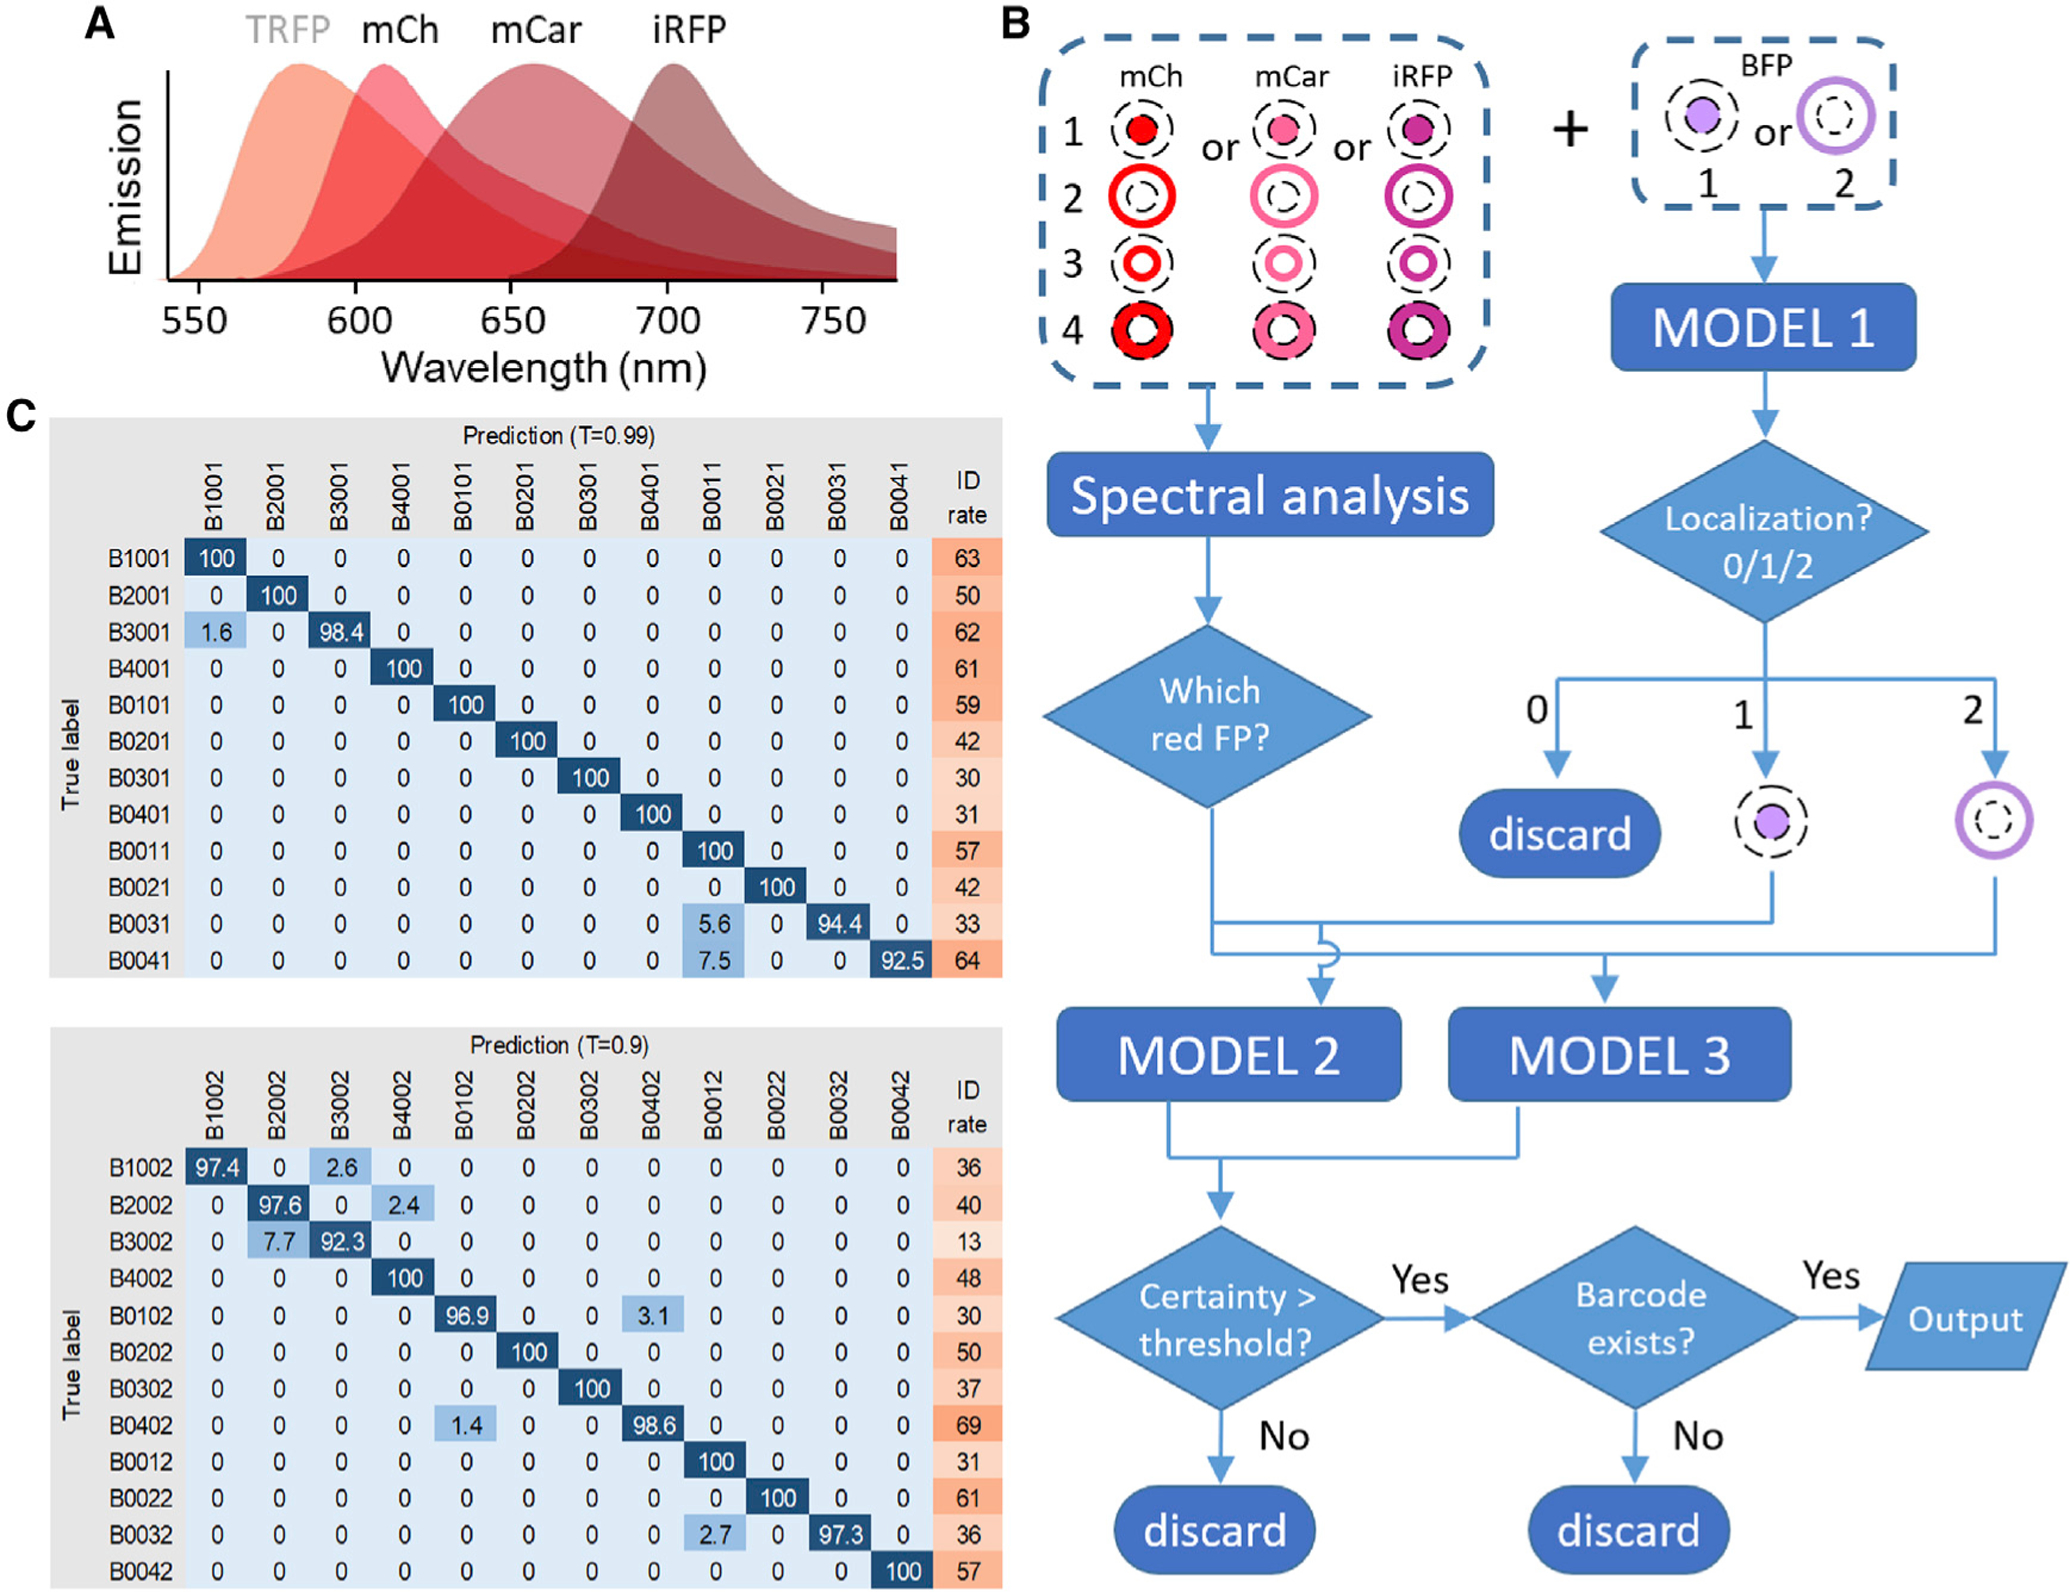
(A) Emission spectra of mCherry (mCh), mCardinal (mCar), and iRFP702 (iRFP) used for barcode reading by deep learning models. TagRFP (TRFP), used in the original barcoding scheme (Figure 1), was replaced by mCherry.
(B) Cells were barcoded by one of the red FPs targeted to four subcellular locations plus BFP targeted to the nucleus or the plasma membrane. The BFP image was classified by model 1. For the red barcoding proteins, spectral profiles were used to determine which of the three unmixed channels corresponded to the correct FP. The unmixed red FP image was then combined with BFP image and classified by model 2 or model 3 depending on whether BFP signal was in the nucleus or membrane. The output was filtered by a certainty threshold and checked for the existence of the barcode.
(C) The confusion matrix and identification rate (%) for all barcodes identified by model 2 (top) and model 3 (bottom) under indicated certainty thresholds. In general, higher certainty thresholds lead to increased accuracy but decreased identification rate. The four numbers in the barcode denote mCherry, mCardinal, iRFP702, and BFP localized to the nucleus (1), plasma membrane (2), nuclear membrane (3), cytosol (4), or non-expressed (0), respectively.