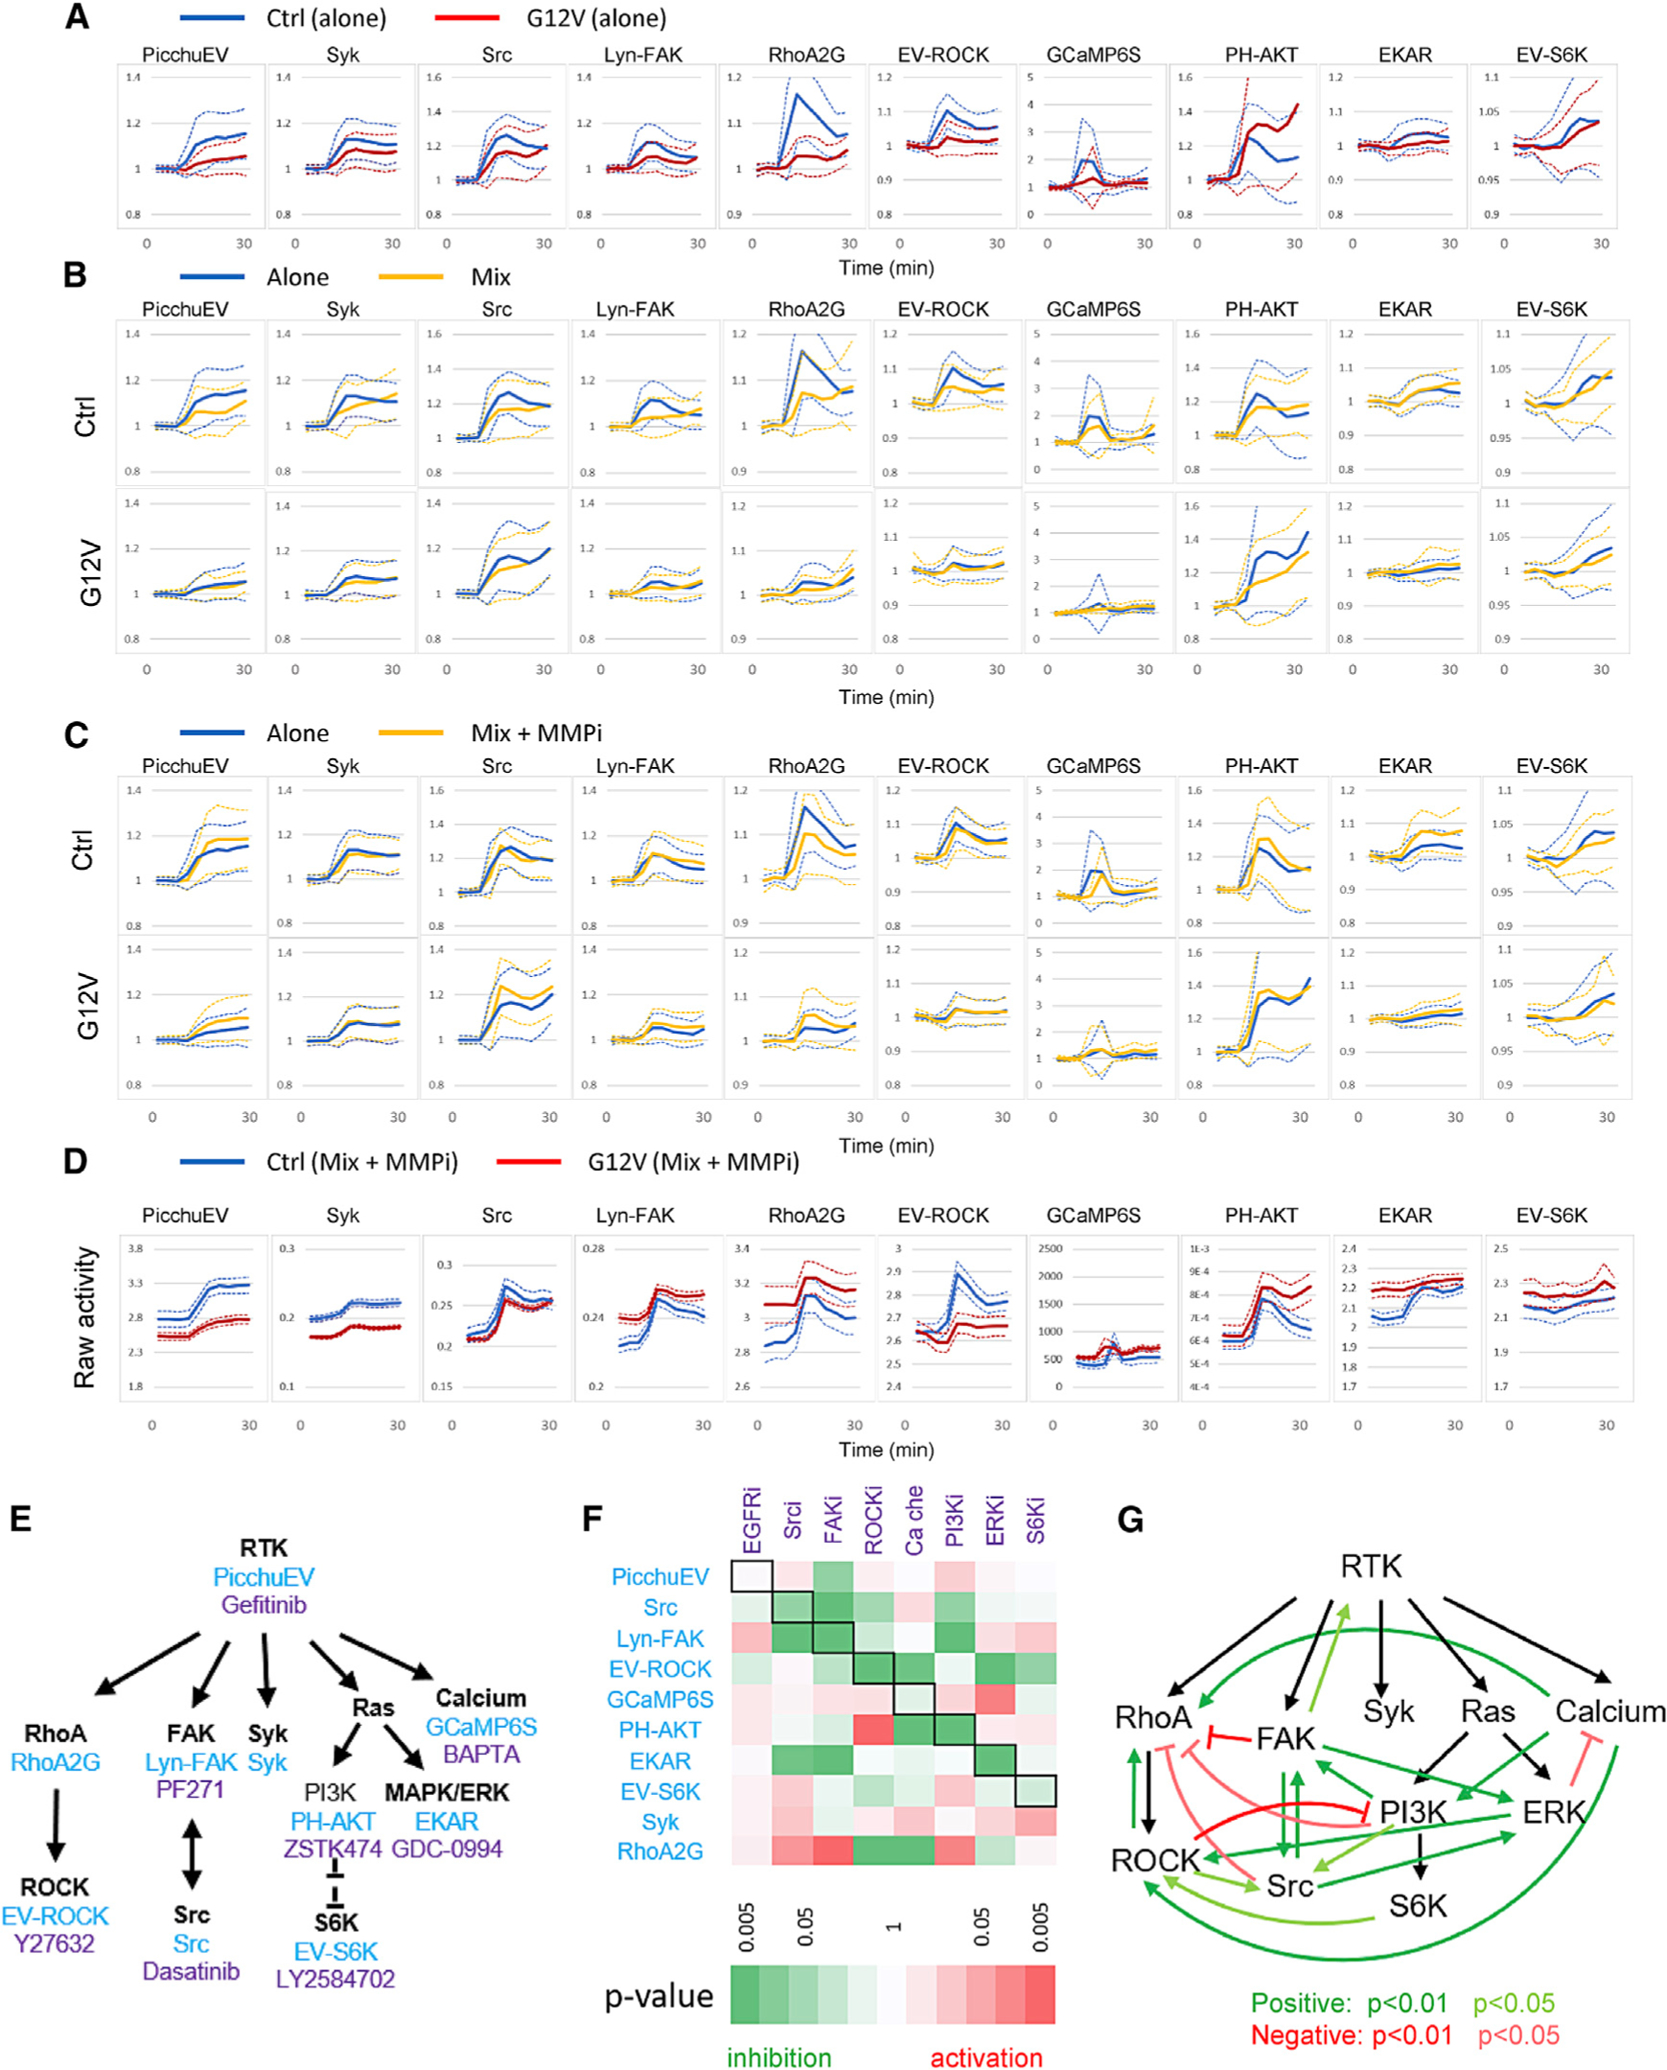
Figure 7. Interactions between pathways and cells.

(A) Normalized responses (mean ± SD) of control cells alone and KRAS(G12V) cells alone to 100 ng/mL EGF stimulation added at 6 min.
(B) Normalized responses (mean ± SD) of control and KRAS(G12V) cells in a 1:1 mix to 100 ng/mL EGF (yellow). The responses of control and KRAS(G12V) cells when they were separately stimulated with 100 ng/mL EGF were plotted for comparison (blue). See also Figure S7.
(C) Normalized responses (mean ± SD) of control and KRAS(G12V) cells in a 1:1 mix to 100 ng/mL EGF with pretreatment of 10 μM TAPI-1 (MMPi, matrix metalloproteinase inhibitor) for 1 h prior to the experiments (yellow). The responses of control and KRAS(G12V) cells when they were separately stimulated with 100 ng/mL EGF were plotted for comparison (blue).
(D) Comparison of raw activities (mean ± SEM) of control and KRAS(G12V) cells in a 1:1 mix pretreated with 10 μM TAPI-1 (MMPi) and stimulated with 100 ng/mL EGF. The raw activities represent mean ± SEM of YFP/CFP (for PicchuEV, RhoA-2G, EV-ROCK, EKAR, and EV-S6K), CFP/YFP (Syk, Src, and Lyn-FAK), cytosolic fluorescence (GCaMP6S), or 1/cytosolic fluorescence (PH-AKT).
(E) Biosensors (blue) and inhibitors (purple) targeting the RTK signaling network.
(F) Inhibition matrix showing the effect of inhibitors on biosensor activities. The effect of an inhibitor on a biosensor was calculated by integrating the activity for all time points after the inhibitor was added minus that of DMSO control. Black boxes denote biosensors corresponding to the targets of inhibitors. Positive and negative effects are shown in red and green, respectively, and the statistical significance is represented by the color scale. See also Table S5.
(G) Feedback loops inferred from the inhibition matrix. Positive (green) or negative (red) interactions were assigned when an inhibitor caused an inhibition or activation, respectively, of another node in the network.
