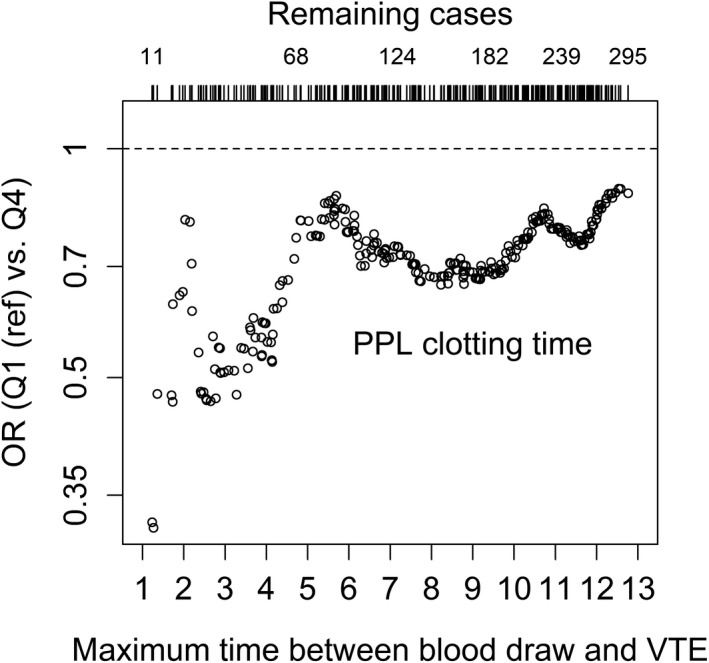
FIGURE 1.

Estimated odds ratios (OR) for venous thromboembolism (VTE) by procoagulant phospholipid clotting time (PPLCT) quartile 4 compared with quartile 1. Each circle represents an analysis for a given maximum time between blood draw and VTE. At each time restriction, only VTE cases with a time below this maximum were included in the analysis, whereas all controls were included. The analysis is adjusted for age, sex, and body mass index
