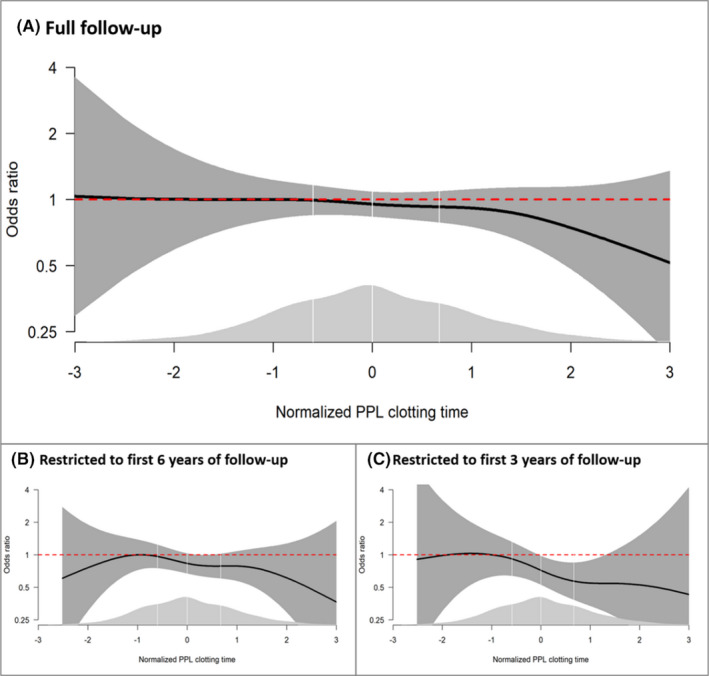
FIGURE 2.

Odds ratios (ORs) of venous thromboembolism (VTE) as a function of procoagulant phospholipid clotting time (PPLCT) in a generalized additive regression model adjusted for age, sex, and body mass index. Panel A shows the results for the full follow‐up, whereas panels B and C show the results of analyses restricted to the first 6 and 3 years of follow‐up, respectively. The solid lines indicate ORs, and the surrounding shaded areas show the 95% confidence intervals. PPLCT values were transformed to follow a perfect standard normal distribution (mean value of 0 and standard deviation of 1) before entering the analyses. The distribution of PPLCT is shown as density plots (light gray) at the bottom; white vertical lines indicate quartile cutoffs
