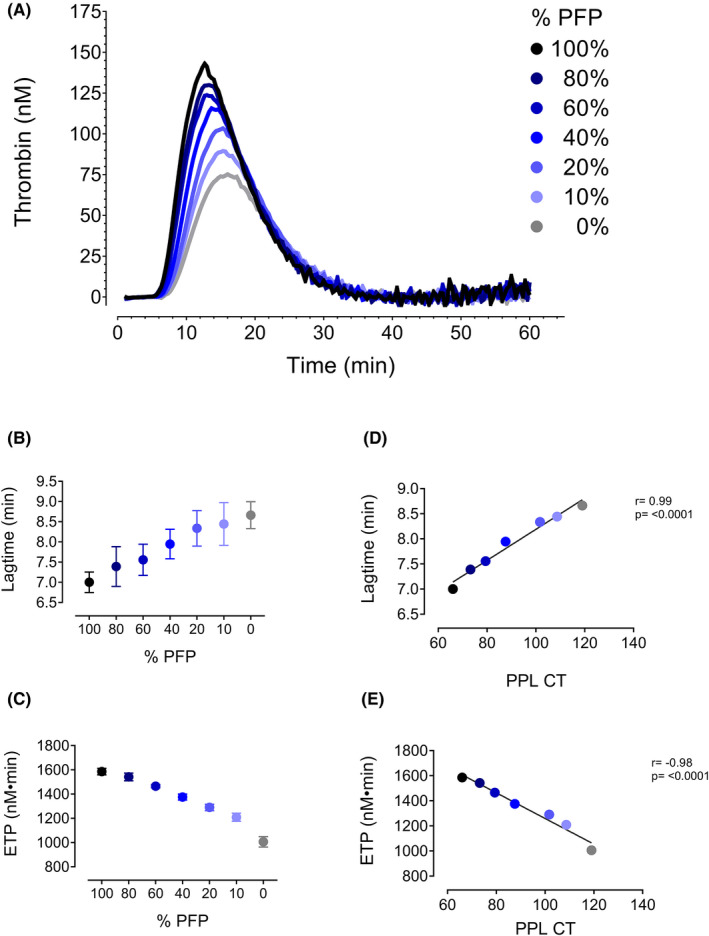
FIGURE 3.

Pooled platelet‐free plasma (PFP) was mixed in varying ratios (100%, 80%, 60%, 40%, 20%, 10%; and 0%) with phospholipid‐depleted plasma (PPLDP) and run on the CAT assay. (A) Thrombin generation curves. A dose‐dependent relationship was observed for both (B) lag time and (C) ETP and % PFP added to the reaction. PPL clotting time (PPLCT) correlates strongly with both (D) lag time and (E) ETP
