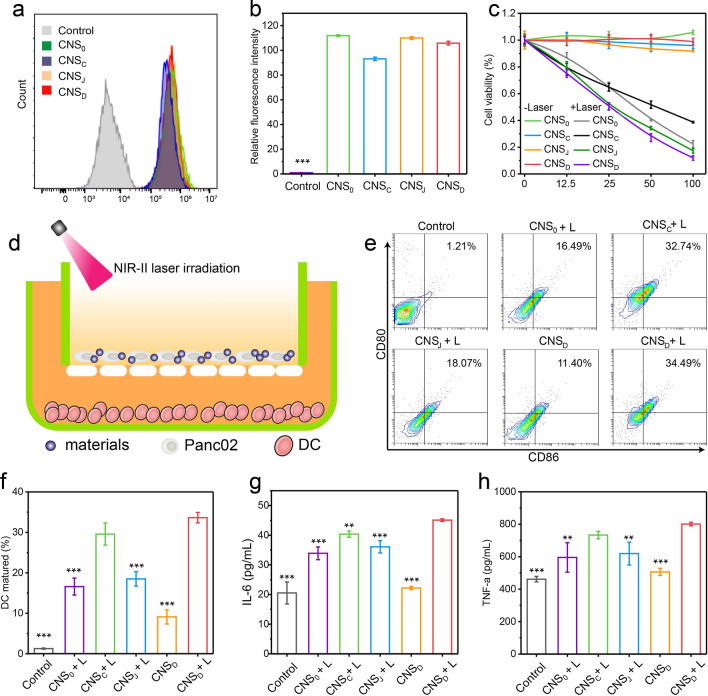
Fig. 2.
a Fluorescence intensity of Panc02 cells treated with PBS (control) or various ICG-loaded CNS nanoparticles ([ICG] = 20 µg mL−1) for 24 h via flow cytometry. b Corresponding relative ICG fluorescence intensity of Panc02 cells after treatment with PBS (control) or various ICG-loaded CNS nanoparticles ([ICG] = 20 µg mL−1) for 24 h via flow cytometry (n = 3). c Cell viabilities of Panc02 cells after treatment with various types of CNS at different concentrations (0, 12.5, 25, 50 and 100 μg/mL) with or without 1064-nm laser illumination (1 W cm−2) for 5 min. d Schematic illustration of CNS-induced DCs maturation in vitro. e Flow cytometry assay of mature DCs (CD11c+CD80+CD86+) in the different groups. f Corresponding quantitative percentages of mature DCs in different groups (n = 3); g, h Quantification of secretion levels of IL-6 (g) and TNF-α (h) in DC suspension (n = 3). **p < 0.01, *** p < 0.001

