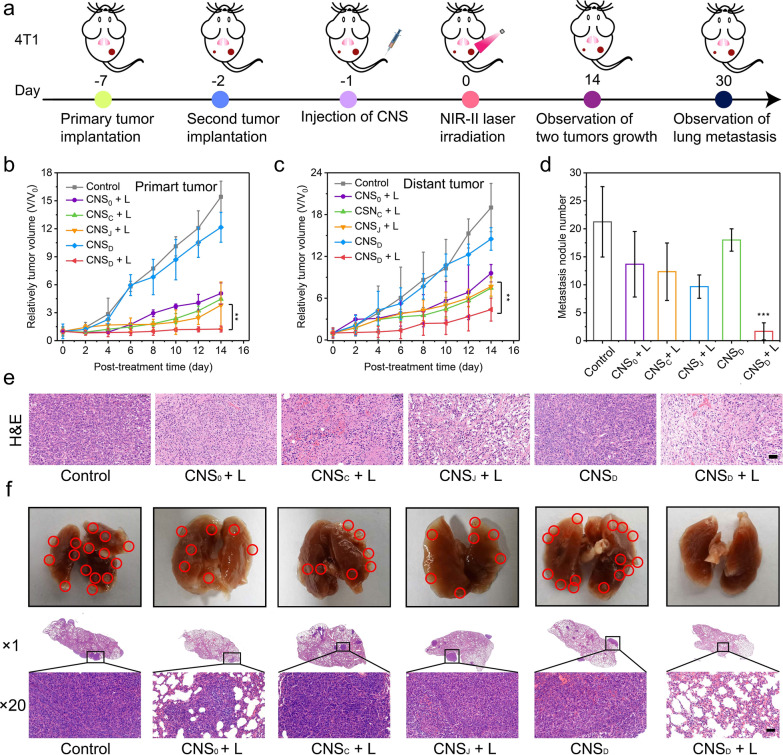
Fig. 4.
a Schematic illustration of 4T1 tumor implantation, treatment, and monitoring. b, c Relative tumor volumes of primary masses (b) and distant masses (c) in 4T1 tumor-bearing Balb/c mice (n = 5) intravenously administered with 0.2 mL of PBS (control) or 300 µg/mL CNS0, CNSC, CNSJ, or CNSD. d Metastatic nodules of the lung in the various groups. e H&E staining of the 4T1 tumors at day 1 after various treatments (the scale bar represents 50 μm). f Digital photos of murine lung tissues and the corresponding H&E staining of the lung tissues at the end of treatments (n = 3, the scale bar represents 50 μm). **p < 0.01 and ***p < 0.001

