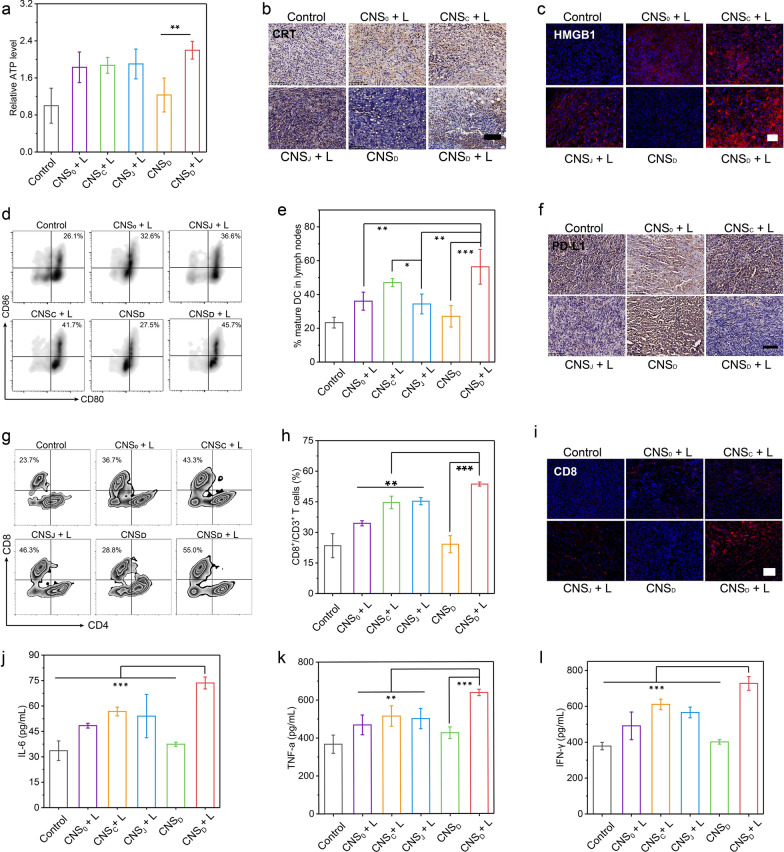
Fig. 5.
NIR-II photoactivated immune activation in vivo. a Intratumoral levels of ATP in Panc02tumor-bearing C57BL/6 mice in the different groups after intravenous injection of 200 µL of PBS or 300 µg mL−1 CNS0, CNSC, CNSJ, or CNSD. b Immunohistochemical staining photos of CRT in tumors sections with different treatments at day 1 post-treatment (blue signal represents cell nuclei and brown signal represents CRT; the scale bar represents 100 μm). c Immunofluorescence staining photos of HMGB1 in tumor sections with different treatments at day 1 post-treatment (blue signal represents cell nuclei and brown signal represents HMGB1; the scale bar represents 50 μm). d, e Flow cytometric plots (d) and corresponding quantitative percentages (e) of matured DCs (CD80+CD86+ gated on CD11c+) in tumor-draining lymph nodes of Panc02 tumor-bearing C57BL/6 mice in various groups at day 3 post-treatment. f Immunohistochemical staining photos of PD-L1 in tumors sections with different treatments at day 14 post-treatment (blue signal represents cell nuclei and brown signal represents PD-L1; the scale bar represents 100 μm). g, h Flow cytometric plots (g) and corresponding quantitative percentages (h) of CD3+/CD4+ T cells and CD3+/CD8+ T cells in distant tumors of Panc02 tumor-bearing C57BL/6 mice in various groups at day 10 post-treatment. i Immunofluorescence staining of CD8 in tumors sections with different treatments at day10 post-treatment (blue signal represents cell nuclei and brown signal represents HMGB1; the scale bar represents 50 μm). j–l Serum levels of cytokines including IL-6 (j), TNF-α (k), and IFN-γ (l) in Panc02 tumor-bearing C57BL/6 mice in various groups at day 3 post-treatment. *p < 0.05, **p < 0.01, and ***p < 0.001

