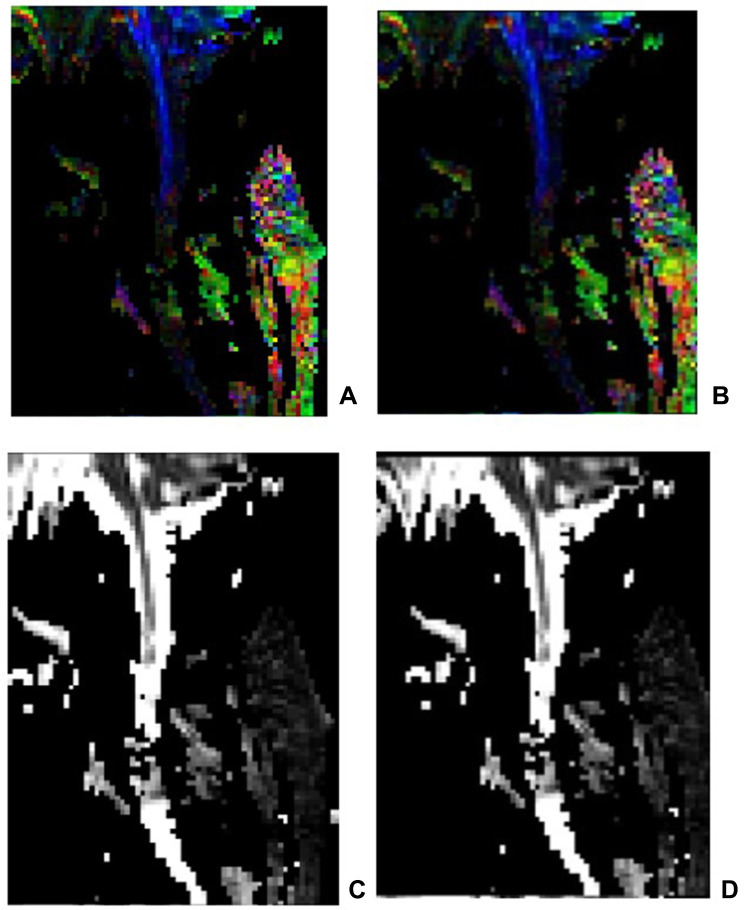
Figure 4.
The FA image and the ADC image in a patient with complete cervical SCI. (A) FA image before the treatment; (B) FA image after the treatment; (C) ADC image before the treatment; (D) ADC image after the treatment. After scanning, DTI images were transmitted to Siemens workstation for post-processing to generate sagittal DTI images of spinal cord, including ADC and FA images. In the zoom and 3D mode of DTI post-processing window, ROI of the same size (about 2 ~ 3 pixels) was placed in the center of the spinal cord lesion area at the selected spinal cord level, and the ADC value and FA value were measured.

