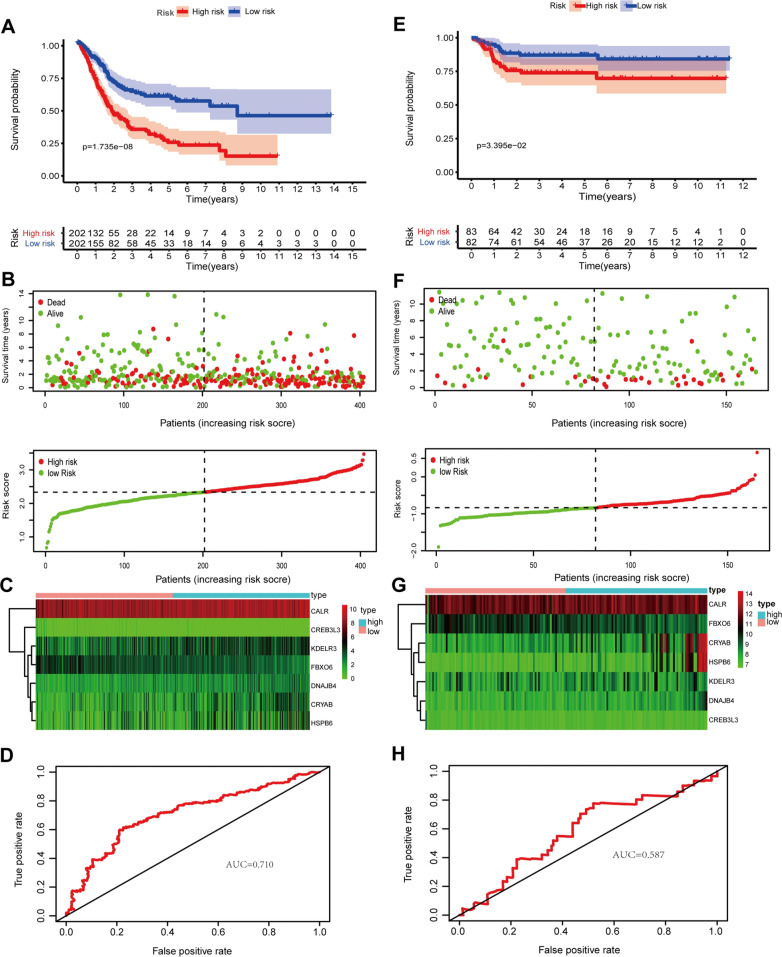
Fig. 5.
The correlation between the prognostic signature and outcome of BLCA patients. A–E Kaplan–Meier survival analysis of BLCA patients between high-risk groups and low-risk groups in TCGA set (A) and GSE13507 set (E); B–F distribution of survival status based on the median risk score in TCGA set (B) and GSE13507 set (F); C–G heatmap displayed the seven prognostic genes in TCGA set (C) and GSE13507 set (G); D–H time-independent receiver operating characteristic (ROC) analysis of risk scores predicting the overall survival in TCGA set (D) and GSE13507 set (H)

