Fig. 2.
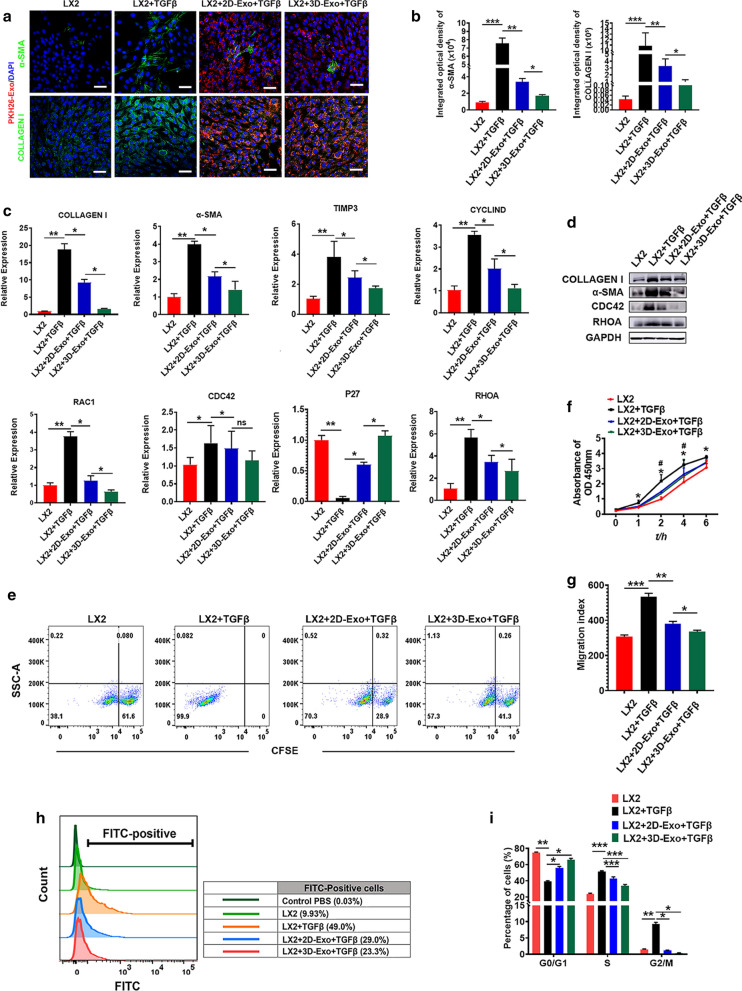
hESC-Exosomes internalized by LX2 cells reduced profibrogenic phenotype. Representative confocal microphotographs of TGFβ-treated LX2 cells exposed to PKH26-labeled 2D-Exo and 3D-Exo (red) and EV-free supernatant for 24 h. a 2D-Exo and 3D-Exo inhibited the expression of COLLAGEN I and α-SMA in activated LX2 cells. The colors of green, red, and blue represent the immunostainings for COLLAGEN I/α-SMA, PKH26 and nuclei, respectively (Original magnification, 20×, Scale bar, 40 μm). b Quantification of integrated optical density of COLLAGEN I and α-SMA in a. c Quantification of COLLAGEN I, α-SMA, TIMP3, CYCLIND, RAC1, CDC42, P27, and RHOA by qPCR. d Representative Western blot analyses of markers COLLAGEN I, α-SMA, CDC42, and RHOA in LX2 cells primed with TGFβ and exposed to 2D-Exo and 3D-Exo for 24 h. GAPDH was used as a loading control. e Proliferation (as measured by the dilution of carboxyfluorescein succinimidyl ester (CFSE)) of LX2 cells and activated LX2 cells with different treatments. f The proliferative activity of LX2 cells in each group were measured by CCK-8 assay at 1 h, 2 h, 4 h and 6 h after treatment. g Wound recovery rates of LX2 cells with different treatment, modeled by cell scratch assays (The images of cell scratch assays were provided in Additional file 1.). h Fluo-3 AM fluorescent probes were used to detect the concentration of calcium ions in LX2 cells of different treatment groups. i Quantification of cell cycle analysis by flow cytometry which was used to measure the growth of LX2 cells and activated LX2 cells exposed to 2D-Exo or 3D-Exo (Flow cytometry analysis used to determine the stages of cell cycle was provided in Additional file 1). Data represent the mean ± SEM. *P < 0.05, **P < 0.01, and ***P < 0.001

