Fig. 5.
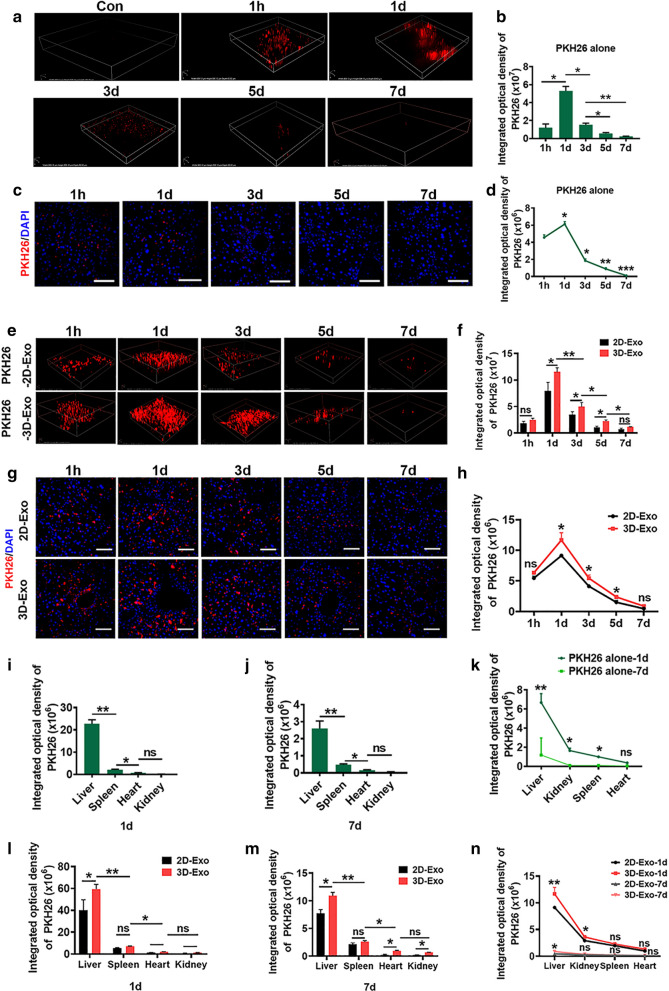
3D-Exo were significantly accumulated in livers of fibrosis mice. a Representative time-dependent in vivo fluorescence images of PKH26 in the livers of mice treated with PKH26 dye only. b Time-dependent fluorescence intensity changes of PKH26 in a was calculated. c Ex vivo CLSM images of the livers of mice sacrificed at different time points. (Original magnification, 25×, Scale bar, 40 μm). d Quantification of integrated optical density of PKH26 in c. e The mice were injected with pKH26-labeled 2D-Exo and 3D-Exo through tail vein. The distribution and metabolism of exosomes in livers at different time points after treatment were recorded by TPEF in vivo. f The integrated optical density analyses of PKH26 in e were quantified. g CLSM images and fluorescence density analysis after the injection with exosome in the livers of mice sacrificed at different time points (Original magnification, 20×, Scale bar, 40 μm). h The integrated optical density analyses of PKH26 in e were quantified. i, k Quantification of the integrated optical density of the fluorescence recorded by TPEF for the enrichment and metabolism of PKH26 dye in liver, kidney, spleen and heart at day 1 (1 d) and day 7 (7 d) respectively after caudal vein injection (TPEF images were presented in Additional file 1). l–n Quantification of the integrated optical density of the fluorescence recorded by TPEF for the enrichment and metabolism of PKH26 labeled-exosomes in liver, kidney, spleen and heart at day 1 (1 d) and day 7 (7 d) respectively after caudal vein injection (TPEF images were presented in Additional file 1). n = 6 in each group. Data represent the mean ± SEM. *P < 0.05, **P < 0.01, and ***P < 0.001

