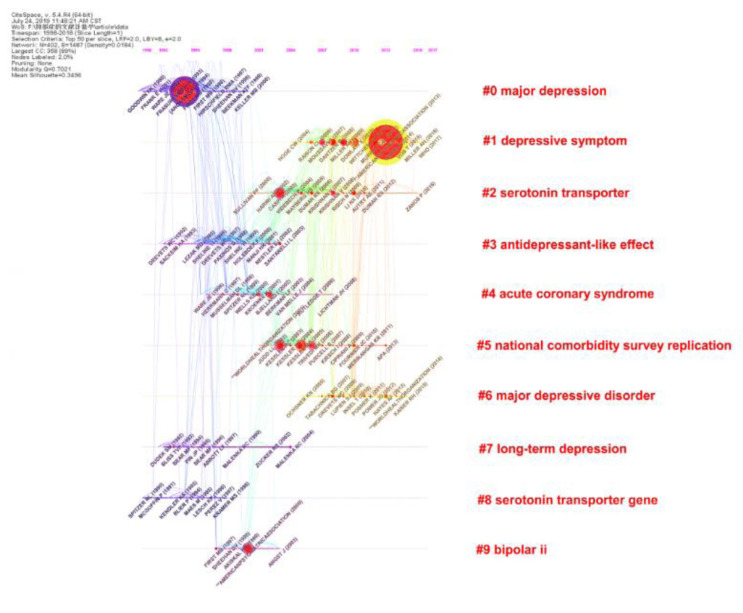
Fig. (5).
Reference timeline view. Node size and color represents total number of citations and a single time slice, respectively. Lines of different colors show that the two articles were co-cited in an article. (A higher resolution / colour version of this figure is available in the electronic copy of the article).

