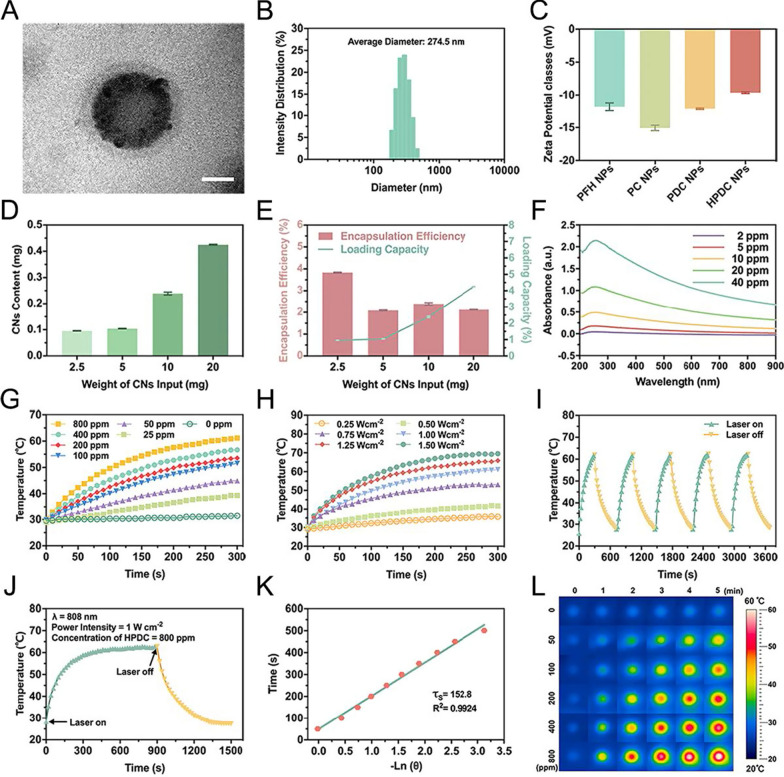
Fig. 1.
Characterization and in vitro photothermal performance of HPDC NPs. A TEM image of HPDC NPs (Scale bar: 100 nm). B Size distribution of HPDC NPs measured by DLS. C Zeta potential measurements of PFH NPs, PC NPs, PDC NPs, and HPDC NPs. D CNs content and E the DEE and DLC of NPs with different initial CN loading (2.5, 5, 10, and 20 mg) (n = 3 per group). F Ultraviolet absorption curves of varying concentrations of CNs (2, 5, 10, 20, and 40 ppm). G Heating curves of varying concentrations of HPDC NPs upon 808 nm laser irradiation (1 W cm−2 for 5 min). H Temperature curves of HPDC NPs aqueous dispersion exposed to 808 nm laser irradiation at varied power densities. I Temperature curves of heating and cooling processes of HPDC NPs aqueous dispersion over five cycles. J Photothermal conversion efficiency of HPDC NPs aqueous dispersion exposed to 808 nm laser irradiation (1 W cm−2 for 5 min). K Thermal time constant of HPDC NPs obtained from the cooling period. L IR thermal images of different concentrations of HPDC NPs dispersion upon 808 nm laser irradiation (1 W cm−2 for 5 min)

