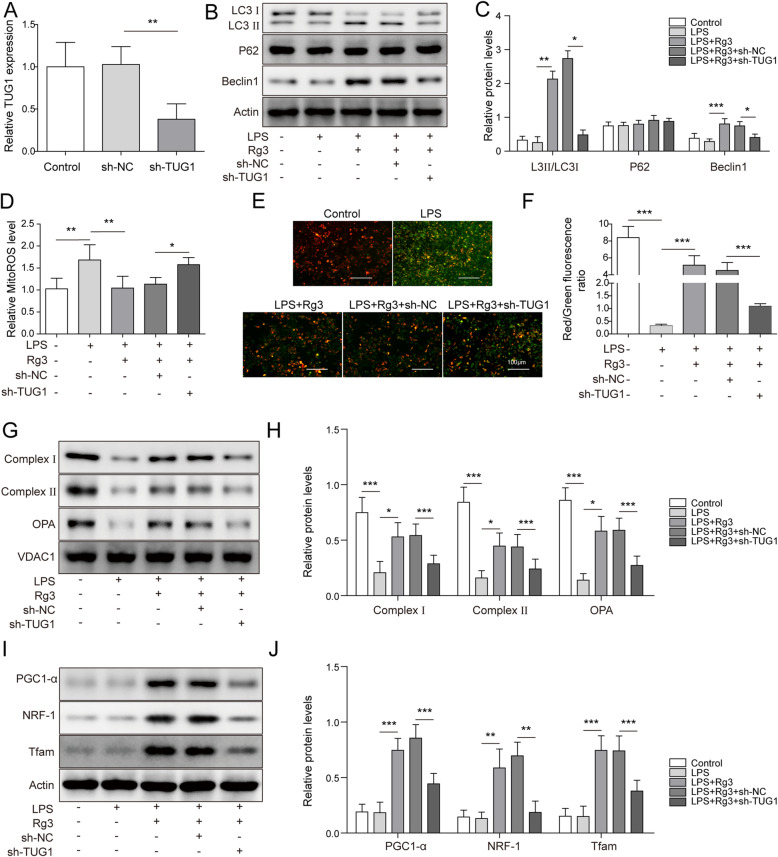
Fig. 2.
TUG1 knockdown almost reversed Rg3-induced mitochondrial dysfunction improvement in LPS-treated hepatocytes. (A) qRT–PCR assay for the relative expression of TUG1 in hepatocytes transfected with sh-NC, or sh-TUG1. (B-J) Hepatocytes were treated with LPS, LPS + Rg3, LPS + Rg3 combined with sh-NC transfection, or LPS + Rg3 combined with sh-TUG1 transfection. (B-C) Western blot assay for the protein levels of LC3, P62, and Beclin-1 in treated cells. (D) MitoSOX Red staining for the mitochondrial ROS level in treated cells. (E-F) JC-1 staining for the MTP level in treated cells. (G-H) Western blot assay for the protein levels of complex I, complex II, and OPA1 in treated cells. (I-J) Western blot assay for the protein levels of PGC1-α, NRF-1, and Tfam in treated cells. n = 3 independent experiments. Differences between groups were compared using the Mann–Whitney U test or Kruskal–Wallis-Wallis test. *P < 0.05, **P < 0.01

