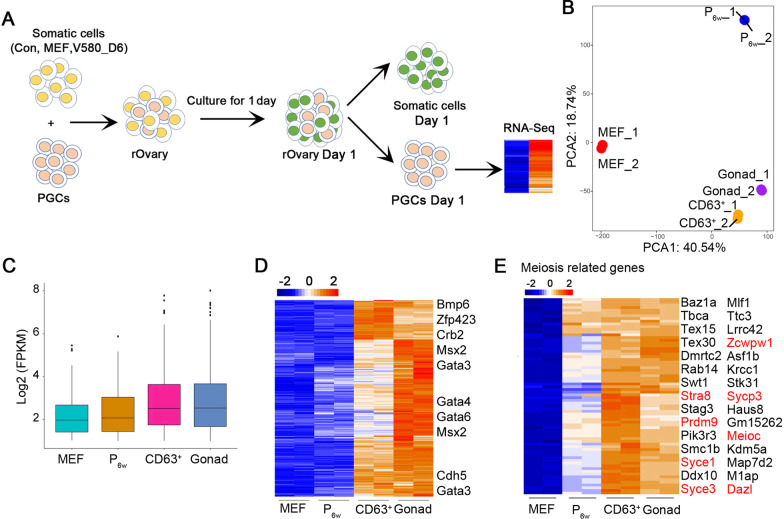
Fig. 6.
PGCs aggregated with CD63+_GSCLCs display transcriptome resembling PGCs aggregated with E12.5_GSCs. A Schematic illustration of PGC separation and collection. B PCA using all genes tested showing close relationship between CD63+ and gonad. C Boxplot showing global gene expression in CD63+, MEF, and P6w compared with gonad by RNA-seq. D Heatmap highlighting the expression pattern of upregulated genes in CD63+, MEF, and P6w compared with Gonad by RNA-seq. E Pheatmap showing expression of meiosis related genes in CD63+, MEF, P6w and Gonad

