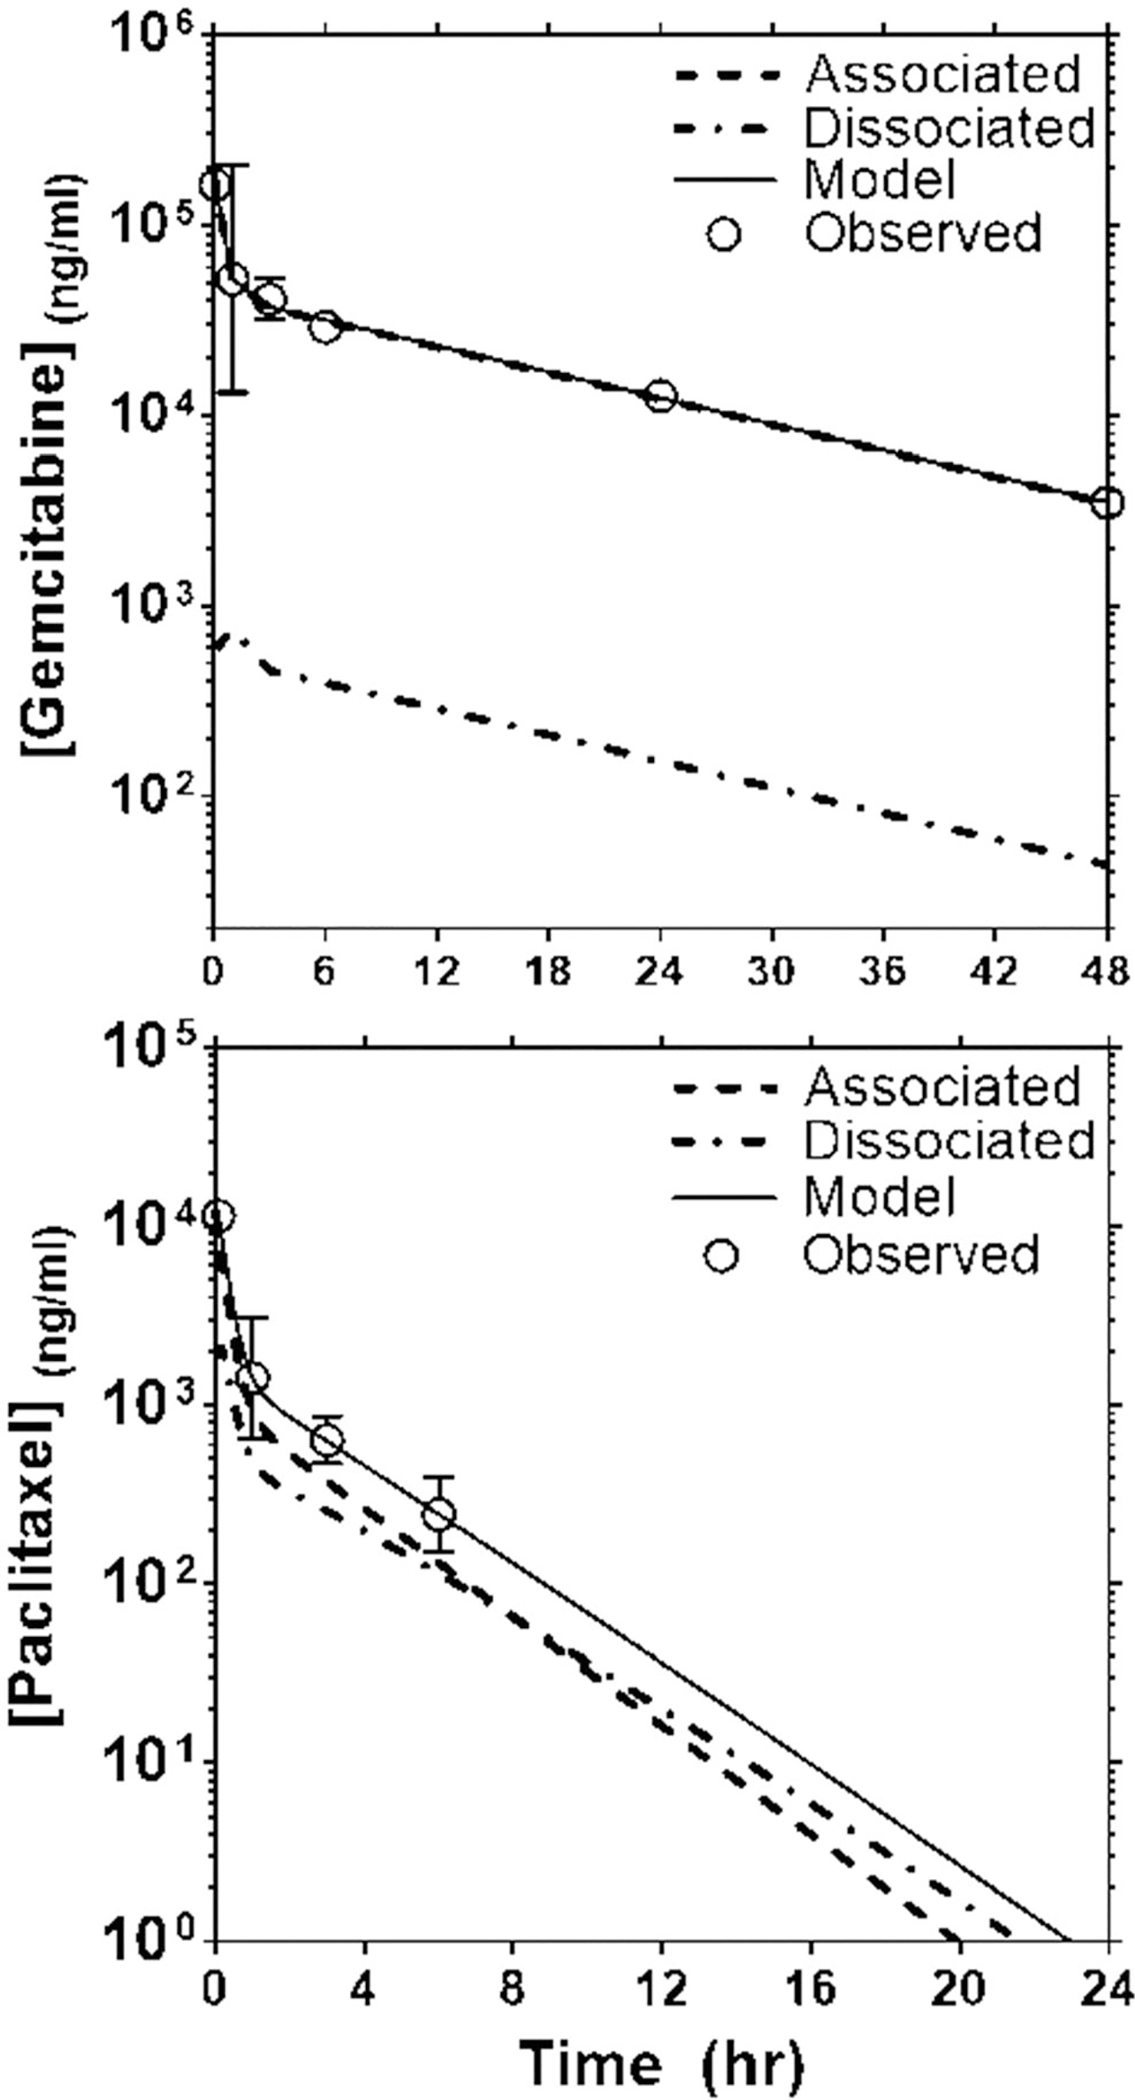
Fig. 5.

Validation of an MBPK model predicted concentration time curve for gemcitabine and paclitaxel with experimental data in mouse plasma after intravenous administration of GT DcNPs. Panel (a) represents the gemcitabine plasma time course of associated and dissociated fractions of drug. The experimental data are presented in open circles (○) with an SD error bar. The MBPK model simulated values are plotted as a continuous solid line. The dotted lines represent the DcNP dissociated gemcitabine concentration over time, simulated by the model. Panel (b) presents the experimental data and simulated DcNP associated and dissociated fractions over time for paclitaxel. The symbol and line representations for Panel (b) are the same as for Panel (a). It is interesting to note that the total simulated plasma concentrations and the DcNP associated species of gemcitabine overlap with most of the gemcitabine remaining DcNP associated throughout the study period.
