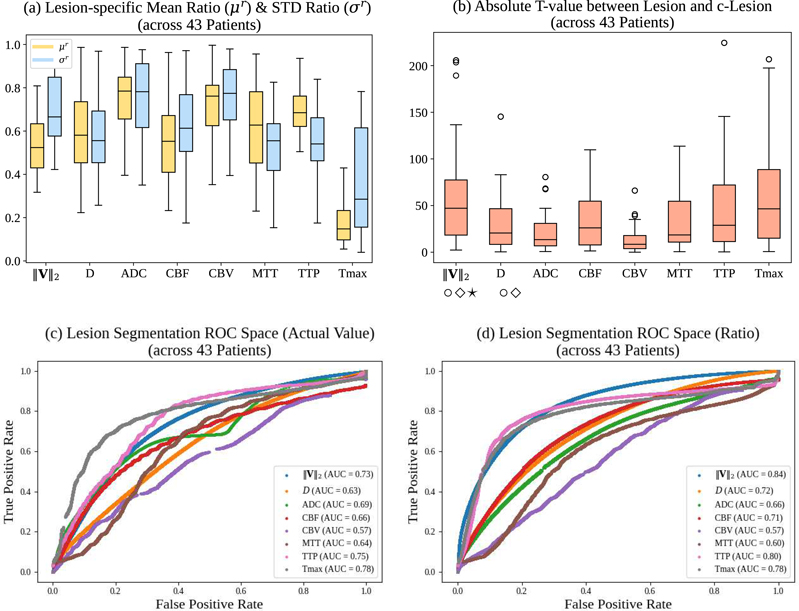
Fig. 11:
Comparison results between PIANO feature maps and ISLES 2017 maps (ADC, CBF, CBV, MTT, TTP, Tmax). (a) Box plots of the lesion-specific mean ratio (μr), lesion-specific STD ratio (σr); (b) Box plots of the lesion-specific absolute t-values (|t|) for all maps, computed from 43 patients. ⋆, ⋄, ○ indicate statistically significant differences between the PIANO feature maps and ISLES 2017 maps respectively, based on a paired t-test with Bonferroni correction at a significance level of 0.05; (c-d) Receiver operating characteristic (ROC) curves of all maps for lesion classification task thresholded based on actual parameter values (c) and ratios (d).

