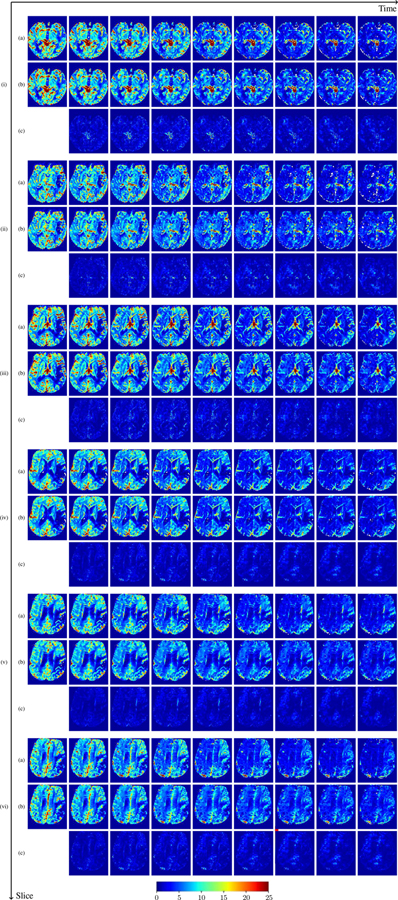
Fig. 13:
Predicted concentration time series for the same patient shown in Fig. ??, where (i)-(vi) correspond to slices #1–6 respectively. Each grouped row displays (a) the measured concentration image sequences, (b) the predicted concentrations and (c) the absolute error of predicted concentration at corresponding time points.

