Fig. 1.
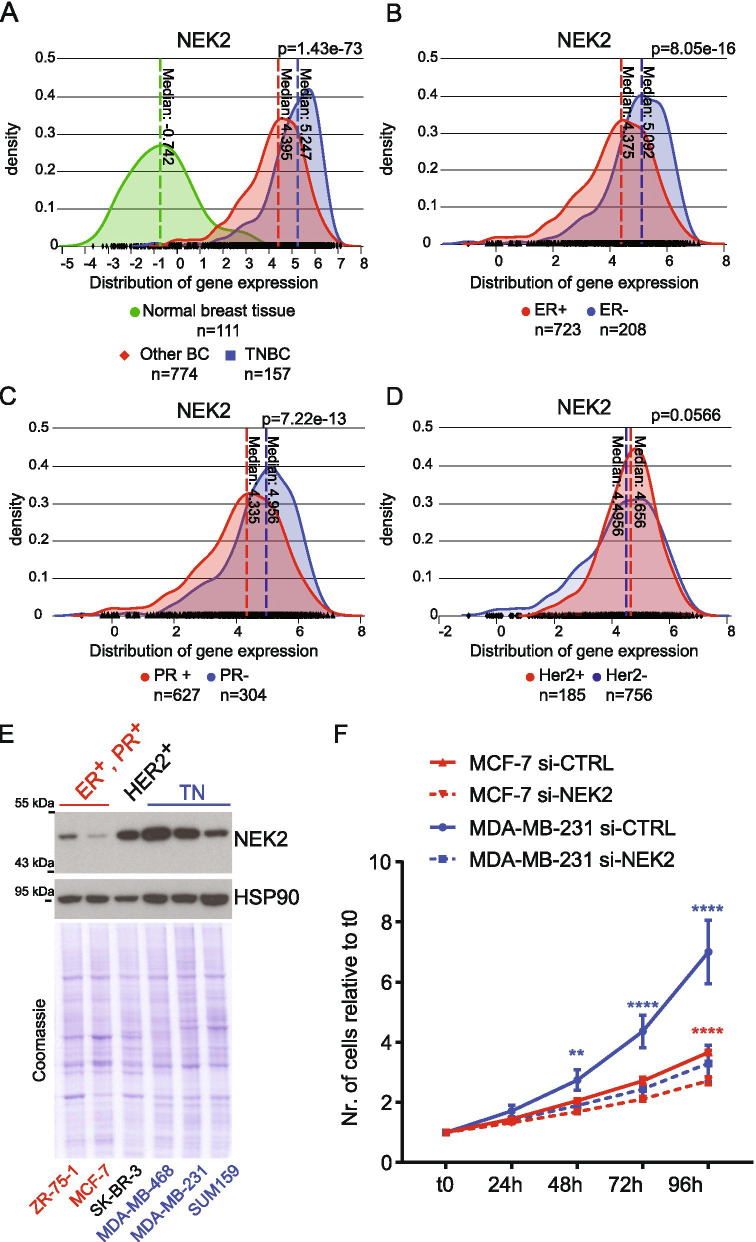
NEK2 is highly expressed in TNBC. A-D Analysis of TGCA data for NEK2 expression using the visual interface of the psichomics R package. A Density plots showing distribution of NEK2 gene expression in normal breast tissues, triple-negative (TNBC) and other breast cancer subtypes (Other BC) (indicated p-value estimated by Kruskal-Wallis rank sum test). B-D Density plots showing distribution of NEK2 gene expression in hormone positive (ER+, PR+) or negative (ER−, PR−) and HER2 amplified (HER2+) or HER2 negative (HER2-) breast cancers (indicated p-value estimated by Wilcoxon rank sum test with continuity correction). E Representative Western blot analysis of NEK2 expression in indicated hormone-positive (ER+PR+), HER2-positive (HER2+) or triple-negative (TN) breast cancer cell lines. HSP90 was evaluated as loading control. F Line graph showing growth rate of MCF-7 and MDA-MB-231 cells transfected with either control (si-CTRL) or NEK2 targeting si-RNAs (si-NEK2). Number of cells at indicated time points was evaluated by IncuCyte® SX5 Live-Cell Analysis Imaging System and normalized to t0 (mean ± SD, n = 4, **p ≤ 0.01, ****p ≤ 0.0001, two-way Anova)

