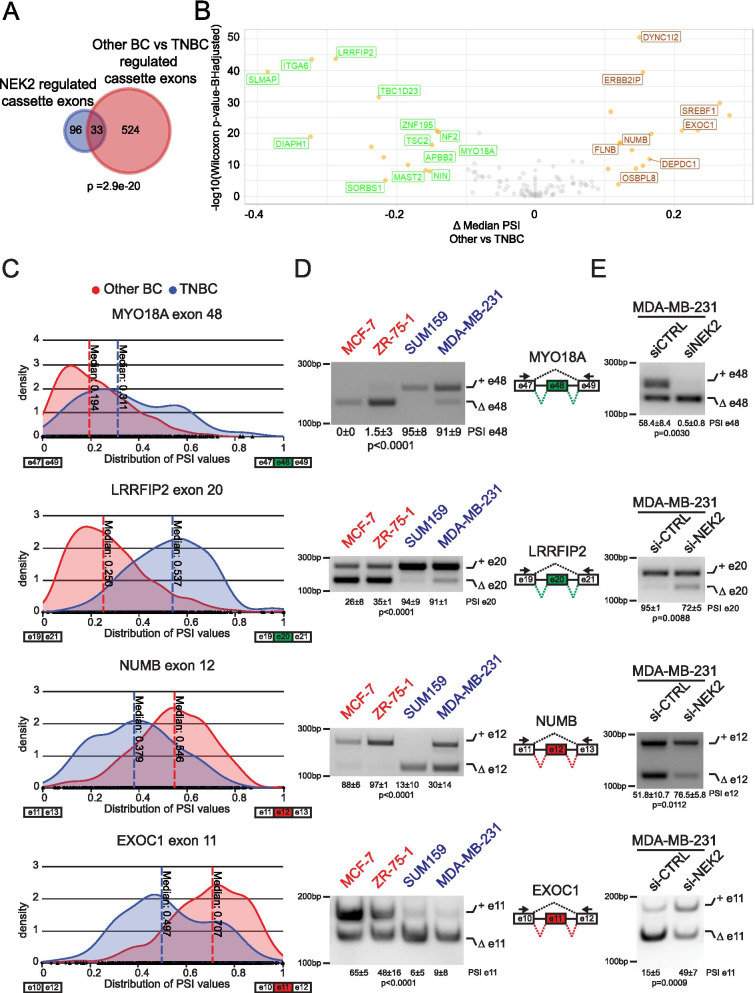
Fig. 3.
NEK2 regulates TNBC specific splicing events. A Venn diagram showing a significant overlap (hypergeometric distribution test) between exon cassettes regulated in the comparison between NEK2 silenced (si-NEK2) and control (si-CTRL) MDA-MB-231 cells and between groups of TNBC and “Other BC” primary tumors. B Volcano plot of differential splicing analysis performed for NEK2-regulated cassette exons in MDA-MB-231 between TNBC and “Other BC”. Significantly differentially events are highlighted in orange (|Δ median PSI| ≥ 0.1 and FDR ≤ 0.01, Wilcoxon rank-sum test with Benjamini–Hochberg (FDR) adjustment). Green or red labels indicate down- and up-regulated exons by NEK2 silencing. C Density plots showing distribution of the inclusion levels of indicated cassette exons in TNBC and “Other BC”. Analysis of TGCA data in (A-C) were performed by using the visual interface of the psichomics R package. D,E Representative PCR analysis for indicated alternative splicing events in indicated BC cell lines representative of “Other BC” (ZR-751, MCF-7) or TNBC (MDA-MB-231, SUM159) subtypes (D) and in si-CTRL or si-NEK2 MDA-MB-231(E). Schematic representation for each event analysed is depicted beside relative agarose gels. Green and red boxes indicate down- and up-regulated exons in si-NEK2 vs si-CTRL cells. Percentage of splicing inclusion (PSI) of indicated exons was evaluated by densitometric analysis, and results are shown below agarose gels [mean ± SD, n = 3, one-way ANOVA (D), t-test (E)]

