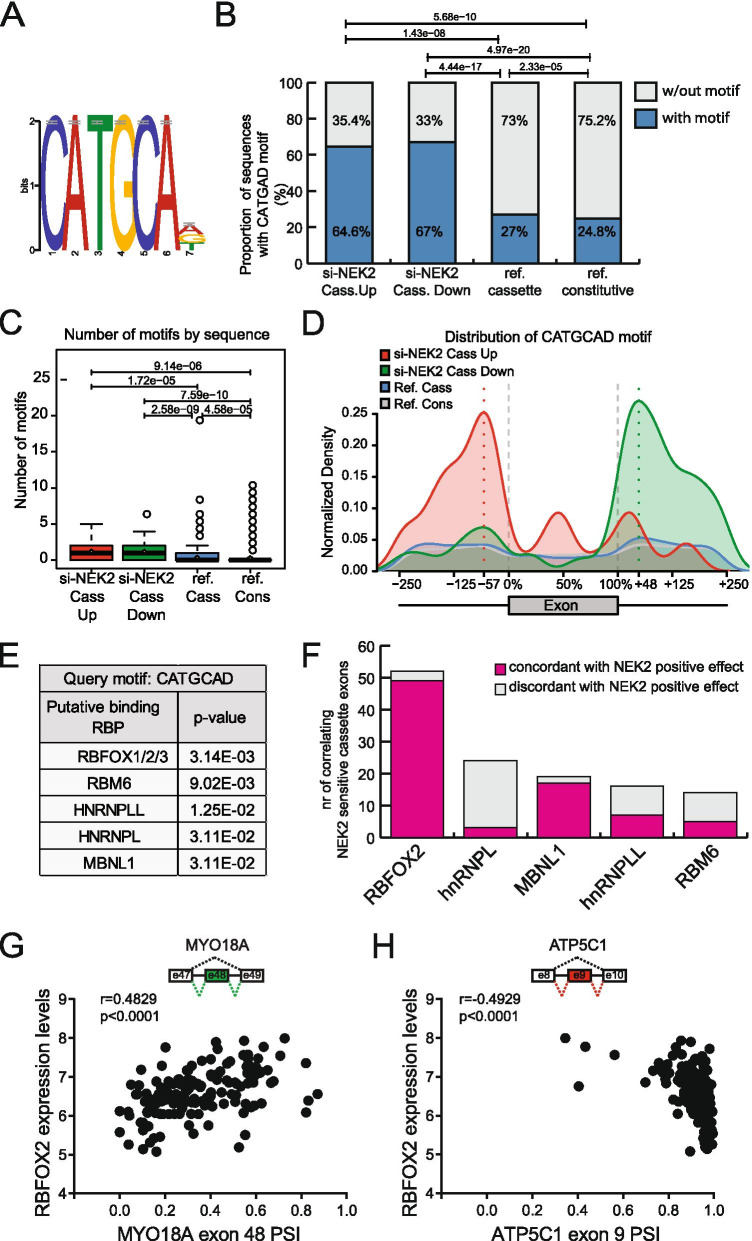
Fig. 5.
A CATGCAD motif is enriched in NEK2 regulated cassette exons. A Logos representing enriched CATGCAD motif within NEK2 regulated cassette exons and flanking introns retrieved from comparative sequence analysis with reference cassette and constitutive exons. B Bar graph showing percentage of sequences having the CATGCAD motif in the indicated groups of si-NEK2-up-regulated (n = 48), si-NEK2-down-regulated (n = 91) cassette exons, reference cassette and constitutive exons. p values above the graph indicate a significant difference in the proportion of sequences among indicated groups (χ2 test). C Box plot showing number of CATGCAD motifs identified in indicated groups of of si-NEK2-up regulated, si-NEK2-down-regulated cassette exons, reference cassette and constitutive exons. p values above the graph indicate a significant difference in the number of motifs among indicated groups (t-test). D Curve graph showing distribution of the CATGCAD motif within exons and their flanking intronic sequences (up to 250 nt) in the groups of si-NEK2 up- (red line) and down-regulated exons (green line), reference cassette (blue line) and constitutive (grey line) exons. E Table showing results of the search with the Tomtom motif comparison tool of putative RNA-binding proteins cognate to the CATGCAD motif. F Bar graph showing the number of NEK2-sensitive cassette exons whose inclusion levels in primary TNBC correlates with the expression of indicated RBPs, in either a concordant or discordant manner with the hypothesis of a positive effect of NEK2 on their activity. G, H Scatterplots of PSI values for indicated cassette exons versus normalized expression of RBFOX2 across TNBC patient in TCGA. Spearman’s correlation coefficients (r) and associated p-values are shown

