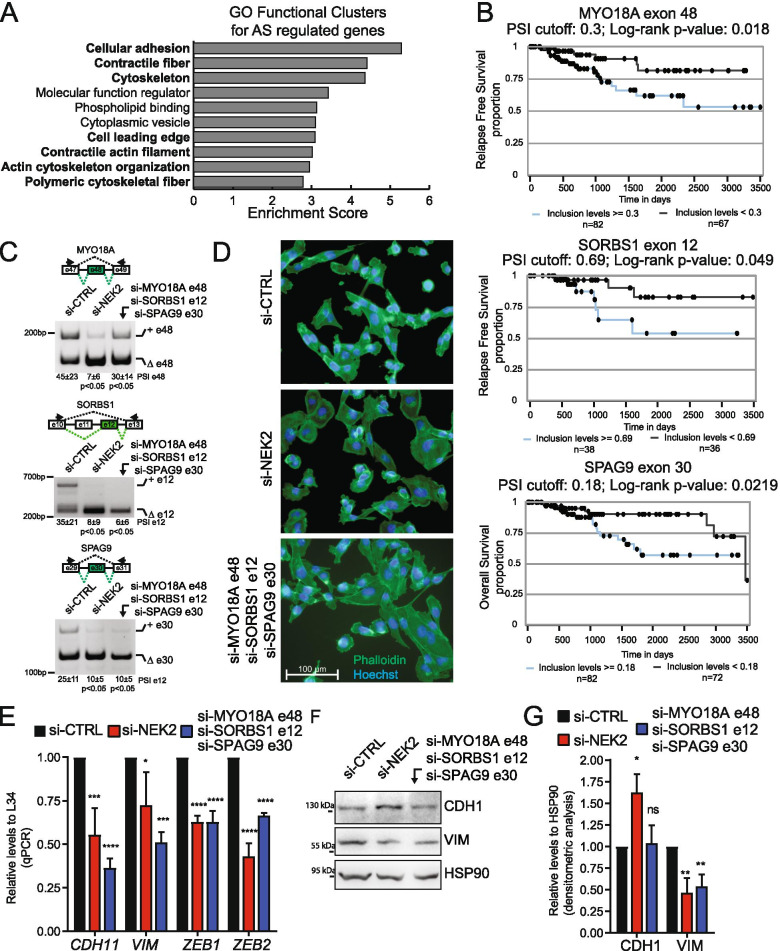
Fig. 7.
NEK2-induced splice variants promote a mesenchymal phenotype in TNBC cells. A Bar graphs showing the enrichment score of the top 10 gene ontology (GO) functional clusters enriched in AS regulated genes in the comparison between control and NEK2 silenced MDA-MB-231 cells (fold enrichment ≥2.0, p-value ≤0.05). GO-clusters related to cell migration and cytoskeletal remodeling are highlighted in bold. B Kaplan–Meier survival curves illustrating the relapse free survival or overall survival probability of TNBC patients stratified according to inclusion levels of indicated NEK2-sensitive cassette exons. PSI-cut-off and p-value are indicated above each graph. Analysis and graphs were drawn by visual interface of the psichomics R package. C PCR analysis evaluating inclusion levels of indicated cassette exons of MYO18A, SORBS1 and SPAG9 genes in MDA-MB-231 cells transfected with siRNAs targeting either NEK2 or indicated specific cassette exons compared to control. Schematic representation for each event analysed is depicted besides relative agarose gels. Percentage of splicing inclusion (PSI) of indicated exons was evaluated by densitometric analysis, and results are shown below agarose gels (mean ± SD, n = 6, t-test). D Representative micrographs of MDA-MB-231 cells cytoskeleton stained with FITC- phalloidin upon transfection with indicated siRNAs. Hoechst dye counterstains nuclei. E qRT-PCR analysis of expression levels of CDH11, VIM, ZEB1 and ZEB2 relative to L34 in MDA-MB-231 cells transfected with siRNAs targeting either NEK2 or indicated specific cassette exons compared to control. (mean ± SD, n = 4, control value set to 1, *p ≤ 0.05, **p ≤ 0.01, ****p ≤ 0.0001, one-way Anova). F, G Western Blot (F) and densitometric analysis (G) of expression levels of E-cadherin (CDH1) and vimentin (VIM) protein in MDA-MB-231 cells transfected with indicated siRNAs. HSP90 was evaluated as loading control (mean ± SD, n = 3, levels in si-CTRL were set to 1, *p-value≤0.05,** ≤0.01; ns = not significant, one-way Anova)

