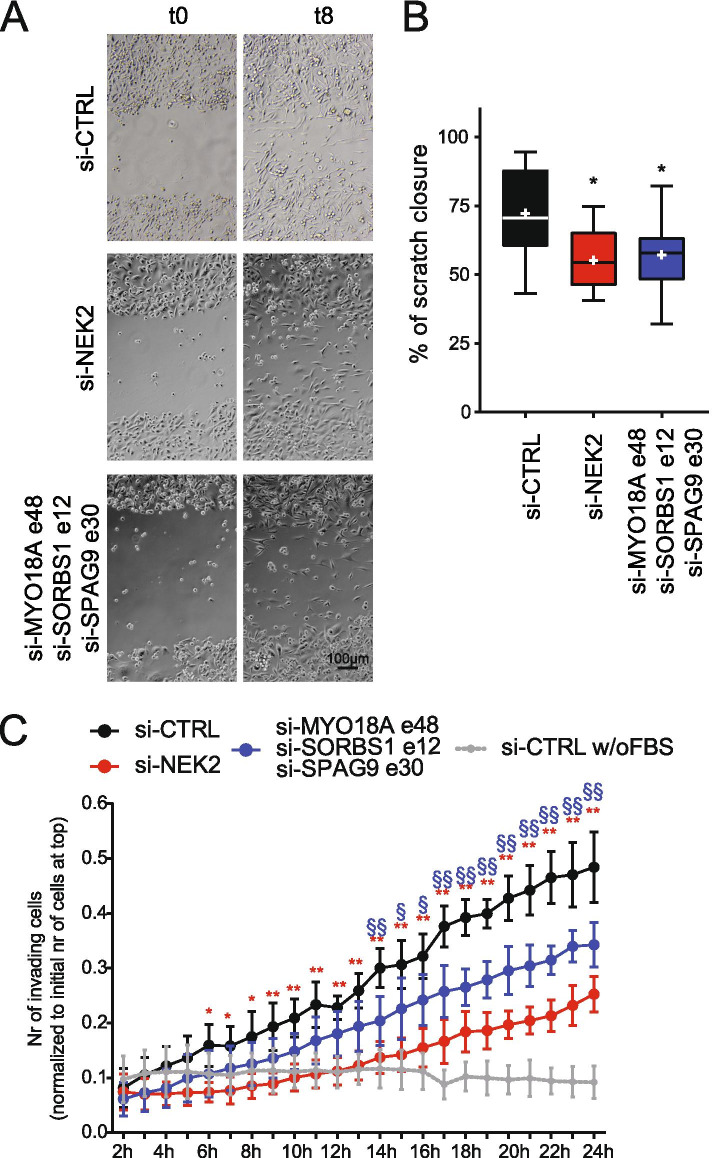
Fig. 8.
NEK2-induced splice variants regulate migratory properties of TNBC cells. A Representative images of the scratch assay performed on confluent layers of MDA-MB-231 cells transfected with indicated siRNAs, at the time scratch was produced (t0) and 8 h later (t8). B Boxplot showing results of quantification of scratch assay displayed in (A). Whiskers indicate min and max value. + mark mean values (n = 3, for each biological replicate, at least 3 measurements were made, one-way Anova). C Line graph showing number of MDA-MB-231 cells, transfected with indicated siRNAs, invading Matrigel-coated transwell of the IncuCyte Clearview 96well insert system. Cell invasion was monitored for 24 h post-seeding using the IncuCyte® SX5 Live-Cell Analysis Imaging System. Migration of control MDA-MB-231 cells towards a lower chamber filled with medium without FBS (w/o FBS) is illustrated as negative control. Number of invading cells on the bottom side of the insert at every hour was normalized to the initial number of cells on the top of the insert at initial seeding (mean ± SD, n = 6, *p ≤ 0.01, **p ≤ 0.001, two-way Anova)

