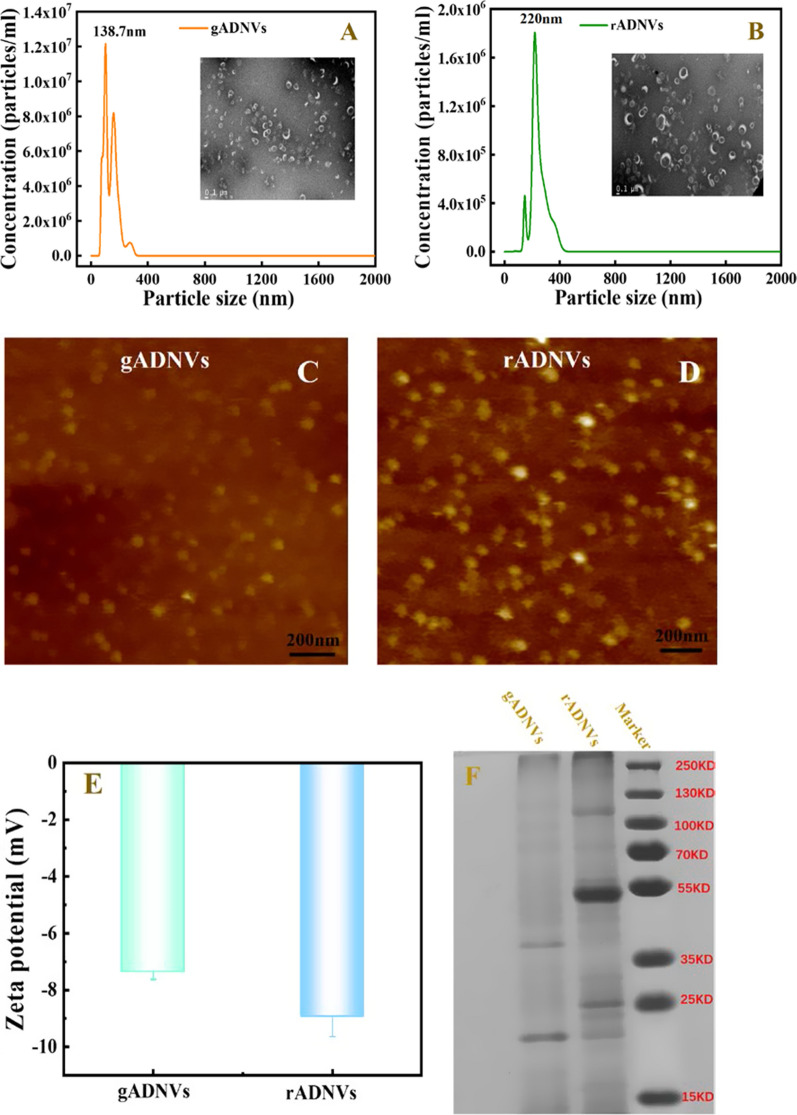
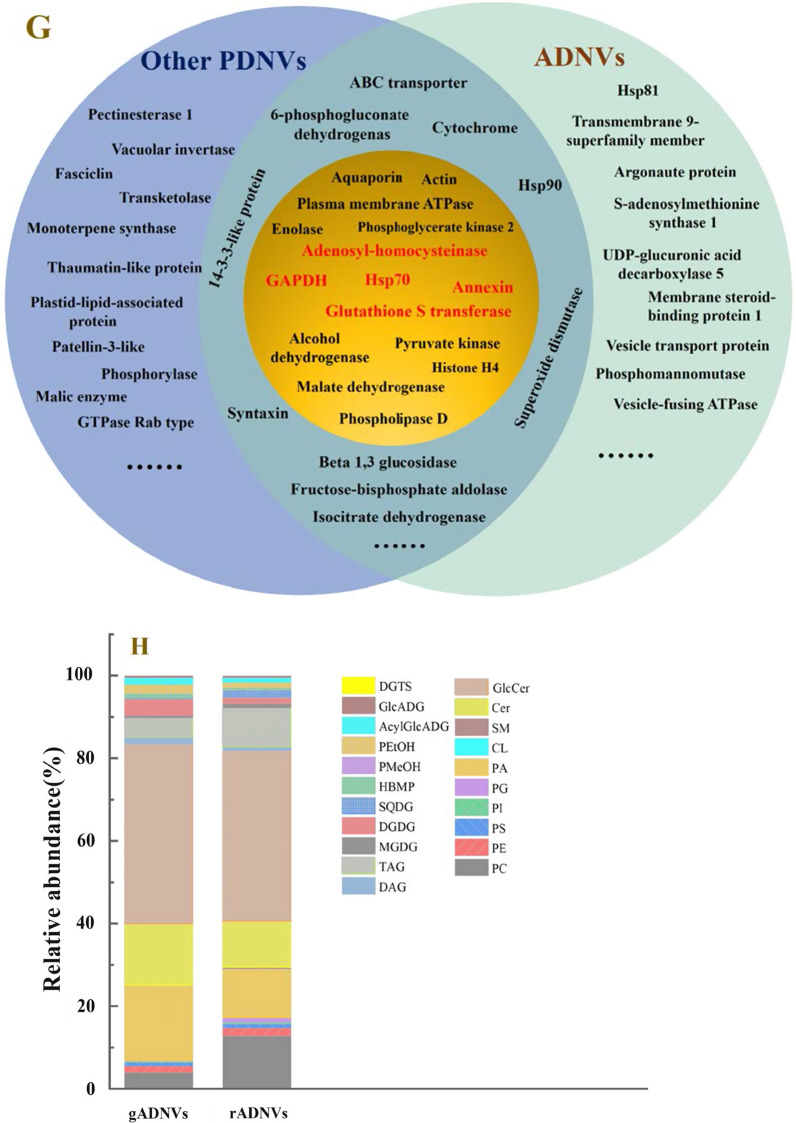
Fig. 2.
Characterizations of ADNVs obtained by the optimized method we proposed. A, B The particle sizes of gADNVs and rADNVs analyzed by NTA. Insets are their morphology and particle size distribution observed on TEM. C, D AFM micrographs of gADNVs and rADNVs. E The zeta potential analysis of gADNVs and rADNVs. F The protein distribution in two kinds of ADNVs analyzed by SDS-PAGE and stained by CBB (Coomassie brilliant blue). G The diagram showing the overlap of the proteins in ADNVs and other PDNVs. The proteins in the yellow circle were repeatedly identified in at least three kinds of PDNVs, while the proteins bold in red were repeatedly identified in at least five kinds of PDNVs. H The lipids compositions of gADNVs and rADNVs (the full name of lipids could be seen in Additional file 1: Table S4)


