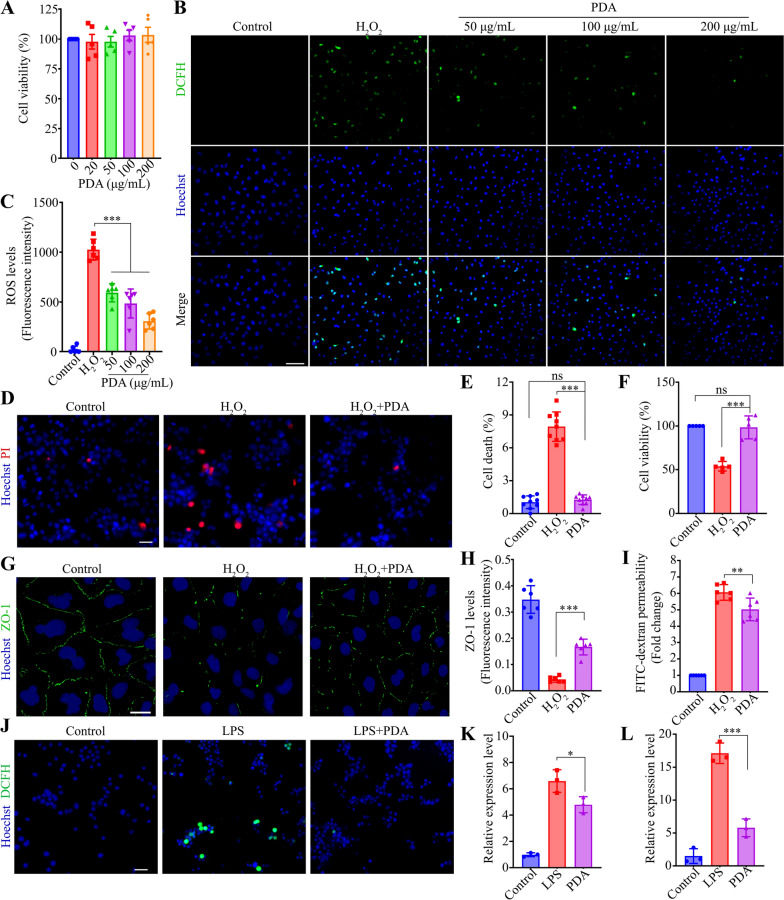
Fig. 2.
The effects of PDA on ROS levels, cell survival and macrophage polarization in vitro. A The cell viability of HUVECs treated with different concentrations of PDA (0, 20, 50, 100 and 200 μg/mL) was determined by CCK-8 assay. n = 5. B, C HUVECs were treated with H2O2 (200 μM) and PDA (50, 100 and 200 μg/mL) for 6 h. ROS levels was assayed by DCFH-DA. Representative images and quantitative analysis (ANOVA) of ROS levels were shown. Scale bar, 100 μm. n = 6. D, E N2a was treated with H2O2 (200 μM) and PDA (200 μg/mL) for 6 h. PI staining was performed to evaluate cell death. Representative images and quantitative analysis (ANOVA) of PI signals. Scale bar, 40 μm. n = 9. F The cell viability of N2a was determined by CCK-8 assay. n = 5. G, H HUVECs were treated with H2O2 and PDA (200 μg/mL) for 6 h. Representative images and quantitative analysis (ANOVA) of ZO-1 levels in HUVECs. Scale bar, 30 μm. n = 6. I Quantitative analysis (ANOVA) of FITC-dextran permeability in HUVEC monolayer. n = 6. J Raw264.7 was treated with LPS (1 μg/mL) and PDA (200 μg/mL) for 12 h. Representative fluorescent microscopy images showing intracellular ROS detected by DCFH in Raw264.7. Scale bar, 40 μm. K, L PCR was performed to detect the mRNA levels of iNOS and TNF-α in RAW264.7. n = 3. *P < 0.05, **P < 0.01, ***P < 0.001. Data are presented as the mean ± SD

