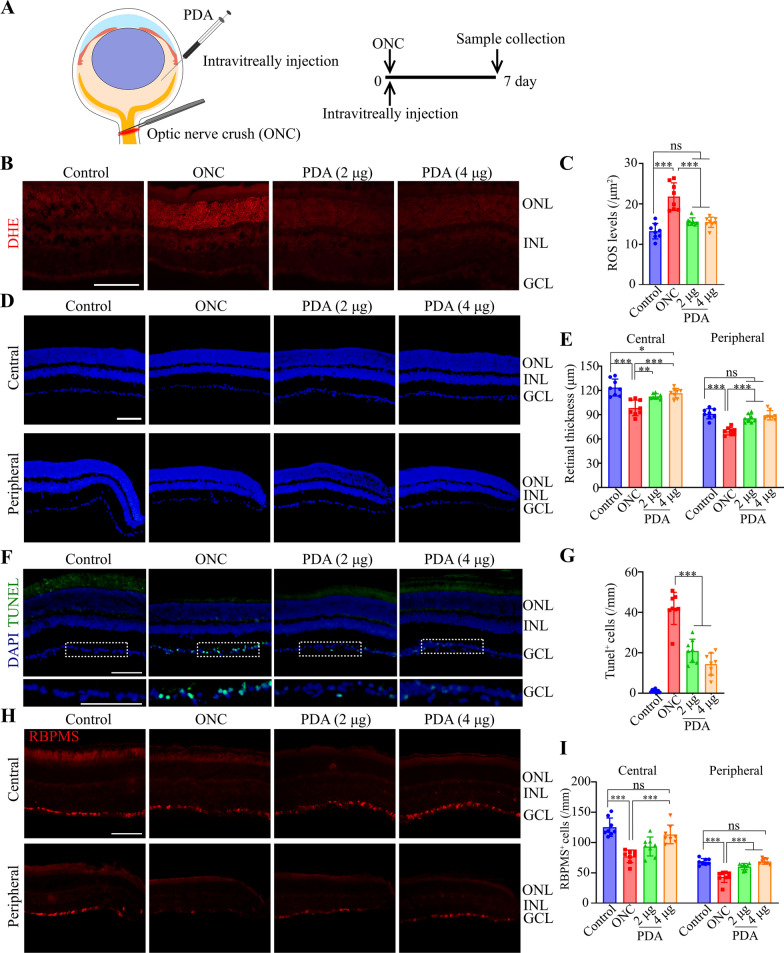
Fig. 3.
The effects of PDA on retinal thickness and neronal loss in ONC models. A Schematic of intravitreally injection of PDA (2 or 4 μg) and the time line for the experiments shown in (B–I). B, C Superoxide anion production was detected by DHE. Representative images and quantitative analysis (ANOVA) of ROS levels in retinal sections. Scale bar, 50 μm. n = 8. D, E Representative images and quantitative analysis (ANOVA) of central and peripheral retinal thickness. Scale bar, 50 μm. n = 8. F, G Representative image and quantitative analysis (ANOVA) of TUNEL signals. Scale bar, 50 μm. n = 8. H, I Retinal sections were immunostained for RBPMS (marker of RGCs). Representative images and quantitative analysis (ANOVA) of RGCs density in central and peripheral retinas. Scale bar, 50 μm. n = 8. *P < 0.05, **P < 0.01, ***P < 0.001. Data are presented as the mean ± SD

