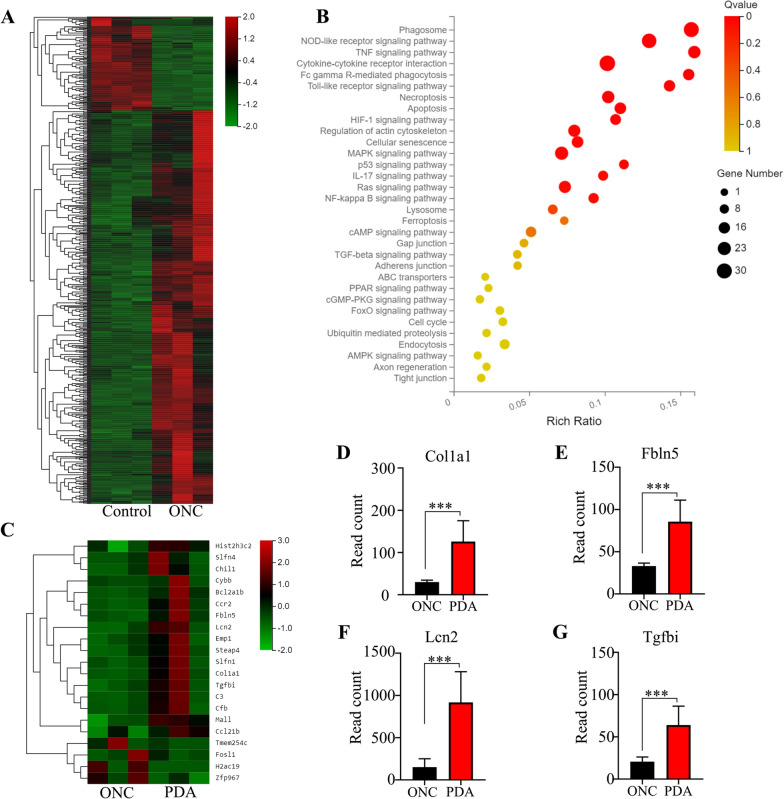
Fig. 4.
Global transcriptome alterations identified by RNA-seq in retinas of PDA-administrated mice. A Heatmap representing the z-score of expression levels of 717 DEG in retinas between control and ONC groups. B The KEGG enrichment for the 717 DEG was evaluated by Rich ratio, Q value and the number of genes enriched in the related pathway. C Heatmap representing the z-score of expression levels of 21 DEG (total 105) between ONC and PDA groups. D–H Histogram illustrating raw gene expression values for oxidative associated genes in DEG between ONC and PDA groups. ***P < 0.001. n = 3. Data are presented as the mean ± SD

