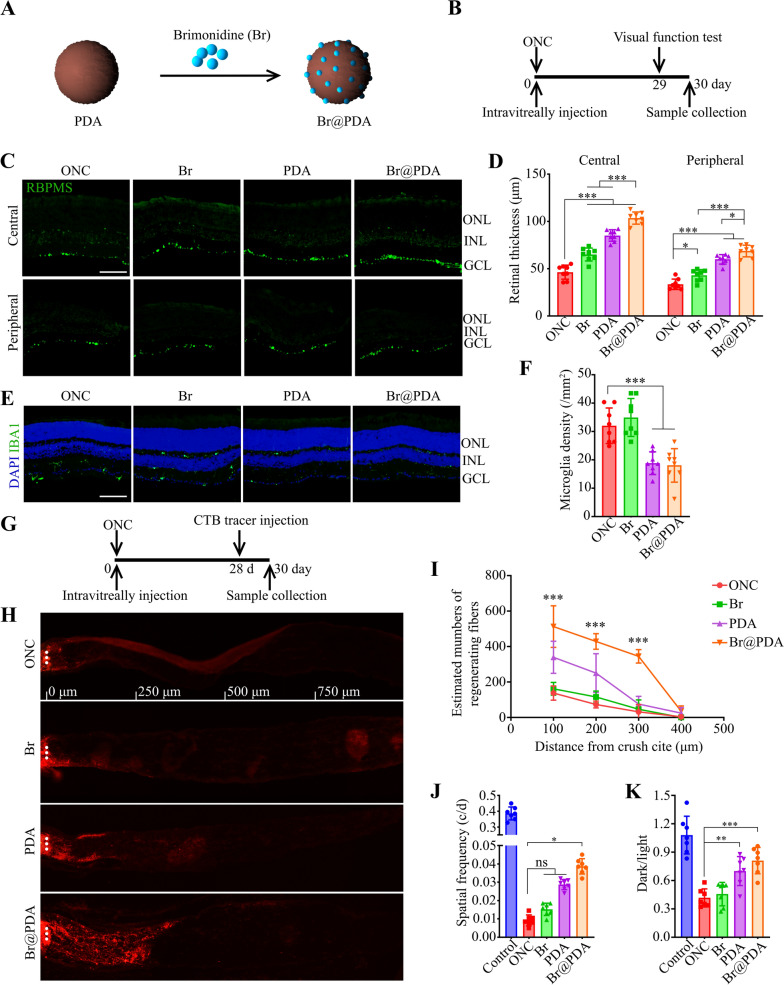
Fig. 5.
The effects of Br@PDA on RGC survival and axon regeneration 30 days after ONC. A Schematic of particles design. B The time line for the experiments shown in (C–F, J and K). C, D Retinal sections were immunostained for RBPMS. Representative images and quantitative analysis (ANOVA) of RGC density in central and peripheral retinas. Scale bar, 50 μm. n = 8. E, F Retinal sections were immunostained for IBA1. Representative images and quantitative analysis (ANOVA) of microglia density in retinas. Scale bar, s50 μm. n = 8. G The time line for the experiments shown in (H, I). H, I Longitudinal sections of the optic nerve showing CTB-labeled axons at 100, 200, 300, 400, 500 μm distal to the injury site. Representative images and quantitative analysis (ANOVA) of CTB signals. ***P < 0.0001 versus ONC group. n = 6. J Quantification (ANOVA) of the optomotor response of mice treated with Br@PDA. n = 7. K Quantification (ANOVA) of the ratio of time mice spent in the dark chamber and light chamber. n = 7. *P < 0.05, **P < 0.01, ***P < 0.001. Data are presented as the mean ± SD

