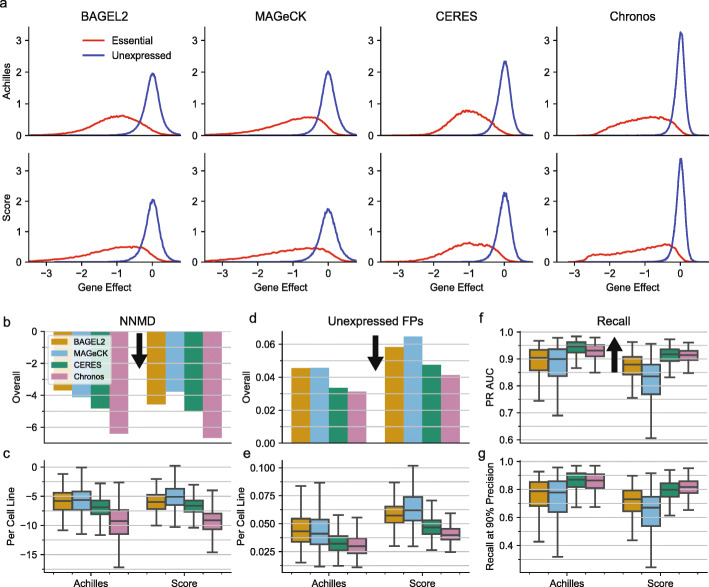
Fig. 2.
Comparison of positive-negative control gene separation across methods for Achilles and Score datasets. a The distribution of all gene fitness effects for unexpressed (negative control) genes and common essential (positive control) genes. Unexpressed genes are identified individually for each cell line (Methods). b Global separation (pooled across cell lines and genes) between gene scores for common essential genes and unexpressed genes in the cell line where they are unexpressed. Separation computed using null-normalized median difference (NNMD). More negative values indicate stronger separation. Black arrows indicate the direction of improved performance. c NNMD for individual cell lines. Boxes indicate the interquartile range (IQR) of NNMDs. Whiskers extend to the last point falling within 1.5 x IQR of the box, and lines indicate medians. d Estimated false positive rate, based on the total percentage of unexpressed genes scoring in most depleted 15% of gene scores within cell lines. e Fraction of unexpressed genes scoring as false positives in individual cell lines. f Area under the precision/recall curve (PR AUC), where recall is the number of common essential gene scores that can be recovered at a given precision. g Fraction of possible common essential gene hits identified at 90% precision in individual cell lines

