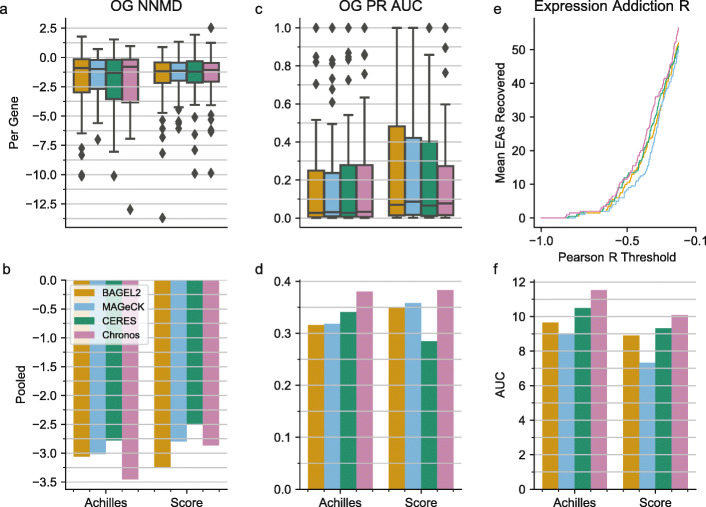
Fig. 4.
Performance on selective dependencies. a For each identified oncogene, the NNMD between cell lines with and without the canonical biomarker. b The results of a when aggregating results across oncogenes with signal. c PR AUC for separating cell lines with an indicated alteration from those without for individual oncogenes. d The results of c when aggregating across oncogenes. e The number of known expression addictions (y-axis) found to have a Pearson correlation lower than X (x-axis). f The area under the curves of e for the individual datasets

