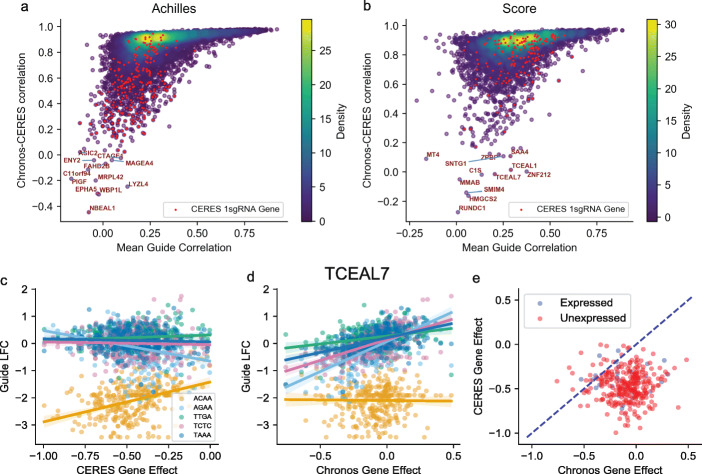
Fig. 6.
Prevalence and cause of differences between Chronos and CERES estimates. a, b The Chronos/CERES gene effect profile correlation for genes with Chronos mean effect greater than -0.5 and standard deviation greater than 0.1 (y-axis) plotted against the mean correlation of the gene’s sgRNAs (x-axis). Genes for which CERES estimates a single sgRNA has at least 0.2 greater efficacy than the others are highlighted. c, d For the gene TCEAL7, the relationship between individual sgRNA log fold-changes (LFCs) and gene effect estimates by either Chronos or CERES. Points are cell lines. Lines show best-fit regression of each sgRNA to the algorithm’s gene effect estimate with shaded 90% confidence intervals. Sequence labels of sgRNAs are truncated to the first four nucleotides for clarity. e CERES vs Chronos gene effect scores for TCEAL7. Dot color indicates whether the gene was expressed or not in each cell line

