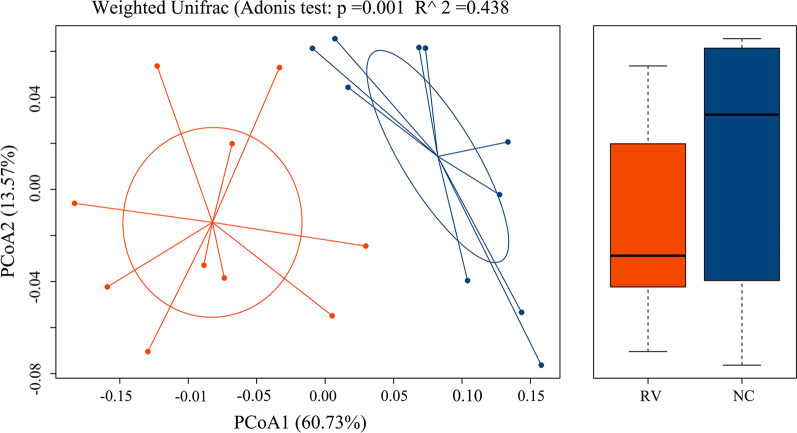
Fig. 3.
Exploration of the beta diversity in the normal control (NC) and RV-infected (RV) groups was assessed by Weighted Unifrac ANOSIM analysis. A principal coordinate analysis (PCoA) plot of the similarities between the different groups based on UniFrac distance. Principal components PCOA1 and PCOA2 explained 60.73% and 13.57% of the variance, respectively. Analysis of Adonis of the bacterial communities in the colorectal contents of the RV and NC groups was based on unifrac distance (R < 0.438 > 0 indicates that the differences between the groups are significant; p < 0.001 indicates that the differences are significant)

