
Fig. 2.
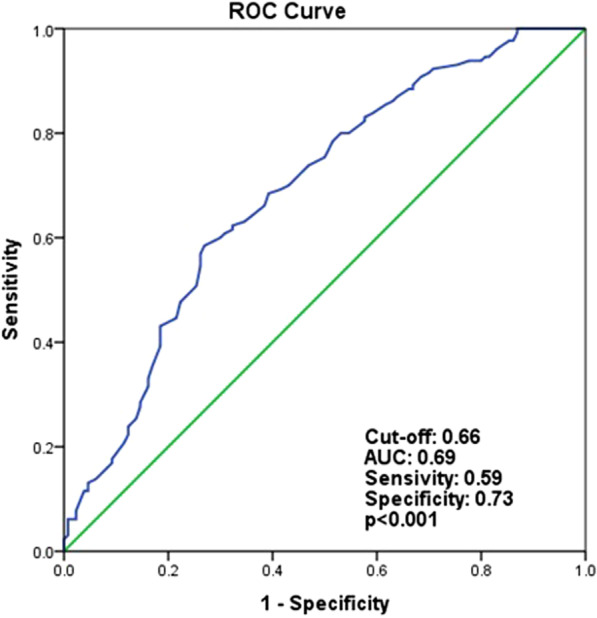
Receiver operating characteristics curve analysis to detect the best cut-off values of atherogenic index of plazma for differentiation between slow and normal coronary flows. AUC area under the curve
Official websites use .gov
A
.gov website belongs to an official
government organization in the United States.
Secure .gov websites use HTTPS
A lock (
) or https:// means you've safely
connected to the .gov website. Share sensitive
information only on official, secure websites.
Receiver operating characteristics curve analysis to detect the best cut-off values of atherogenic index of plazma for differentiation between slow and normal coronary flows. AUC area under the curve