
Extended Data Fig. 10. TEPP-46 ablates HFCS-induced villus elongation, tumor growth.
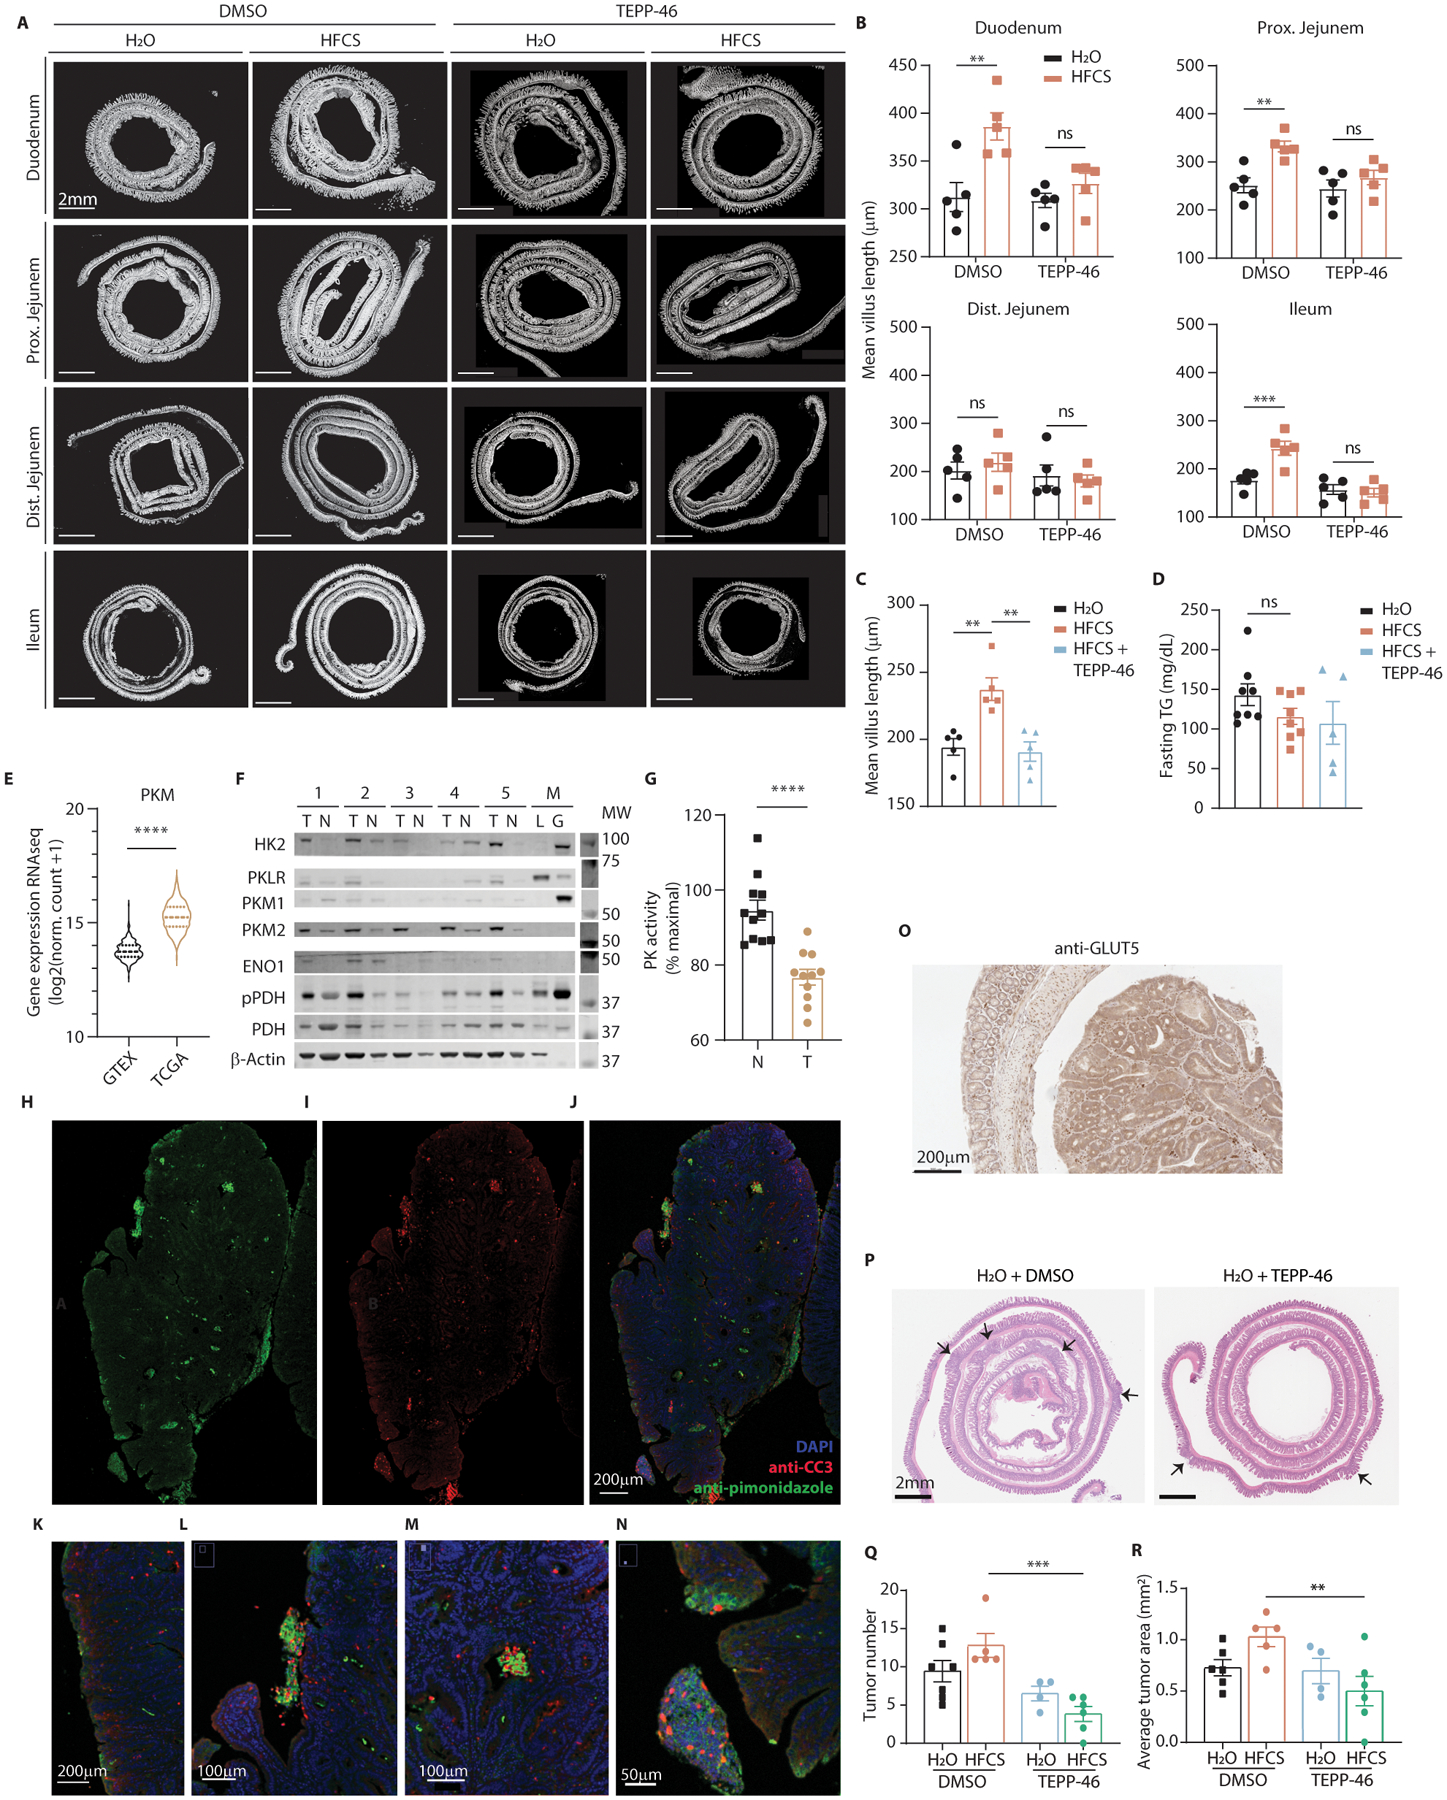
(A) WT mice provided with a daily oral gavage of HFCS or H2O mixed with DMSO or TEPP-46 were sacrificed after 10 days. Intestines were harvested and analyzed for mean villus length. (B) Villi measurements for those same sections (n = 5 mice per group). (C) Mice were treated with normal chow and either water for two weeks, 25% HFCS daily gavage for two weeks, or HFCS for two weeks followed by HFCS with TEPP-46 (2mg/kg/day) for another two weeks. At the conclusion of these treatments, the animals were sacrificed and small intestine villus length was examined (n = 5 mice per group). (D) Mice were fed the indicated diets via oral gavage for 2 weeks and serum TG content was measured during the fasted state (mice per group, left to right: 8|8|5). (E) Violin plot of gene expression data from GTEX (normal human colon epithelium) and TCGA (human colon adenocarcinoma) are displayed for PKM. (F) Patient samples of colon tumor (“T”) and matched normal epithelium (“N”) were lysed and analyzed by western for PK isoform expression and hypoxia markers. Mouse liver and gastrocnemius are included as controls. (G) PK activity was measured in patient sample lysates before and after incubation with PK activator, and the ratio of initial vs activated activity is shown (tumor and adjacent normal tissue pairs from n = 11 patients). (H-J) Single channels and composite image of normal diet-treated APCQ1405X intestinal tumors stained with DAPI, anti-CC3, and anti-pimonidazole and examined via immunofluorescence. (K-N) Fly-out panels depicting areas of CC3 and pimonidazole colocalization both along the tumor periphery (K, L) and in the tumor core (M, N). Scale bars as indicated. (O) Normal diet-treated intestinal tumors were also examined by IHC using anti-GLUT5 (scale bar: 200μm). (P) Representative H&E-stained intestinal swiss rolls from APCQ1405X/+ mice treated with the indicated regimens. Arrows indicate tumor; scale bar = 2mm. (Q, R) H&E images of intestinal swill rolls were analyzed for tumor burden. Each tumor in the section was counted and its cross-sectional area measured (mice per group, left to right: 6|5|4|6). B, Q, R: Two-way ANOVA followed by Holm-Sidak post-test for multiple comparisons; C, D: One-way ANOVA followed by Holm-Sidak post-test for multiple comparisons; E, G: two-sided student’s t-test; ns: not significant; **P<0.01, ***P<0.001, ****p<0.0001; all error bars represent means ± S.E.M. For gel source data, see Fig. S2 in the supplement.