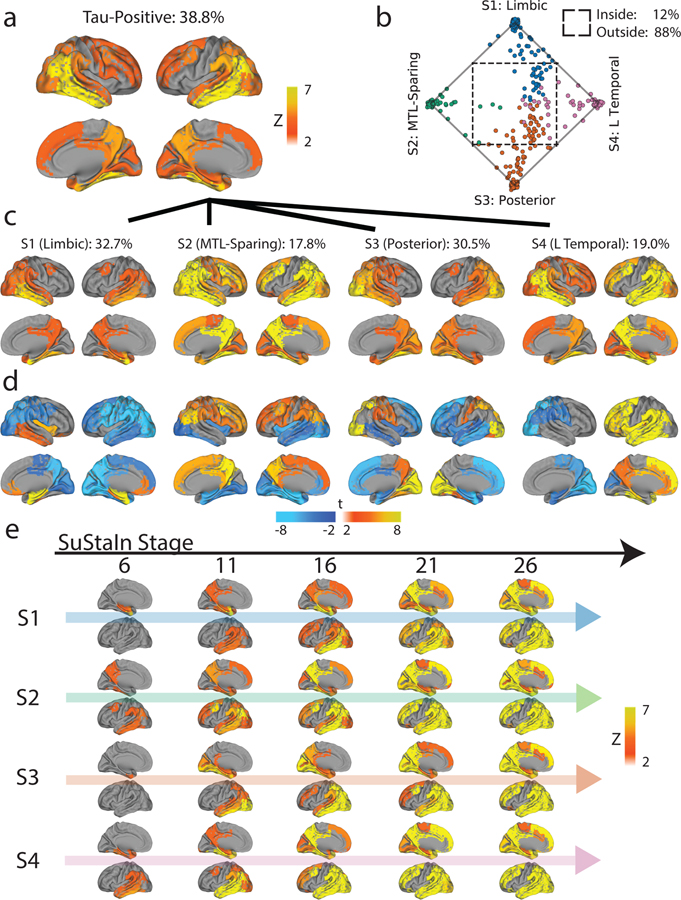
Figure 1.
Spatiotemporal subtypes of tau progression. A) Tau-PET pattern of tau-positive (subtyped) individuals. B) Quarternary plot showing probability each individual is classified as each subtype. Dots are labeled by final subtype classification: S1 (blue), S2 (green), S3 (orange) or S4 (pink). Inset box shows individuals that had a probability < 0.5 to be classified as any of the four subtypes (i.e. showing poor fit). C) Average tau-PET pattern for each subtype. The colorbar is the same as Panel A. D) Regions showing significant difference between one subtype and all other subtypes using OLS linear models adjusting for SuStaIn stage, after FDR correction. E) Progression of each subtype through SuStaIn stages. Each image is a mean of individuals classified at the listed stage and up to four stages lower. Only the left hemisphere is shown.

