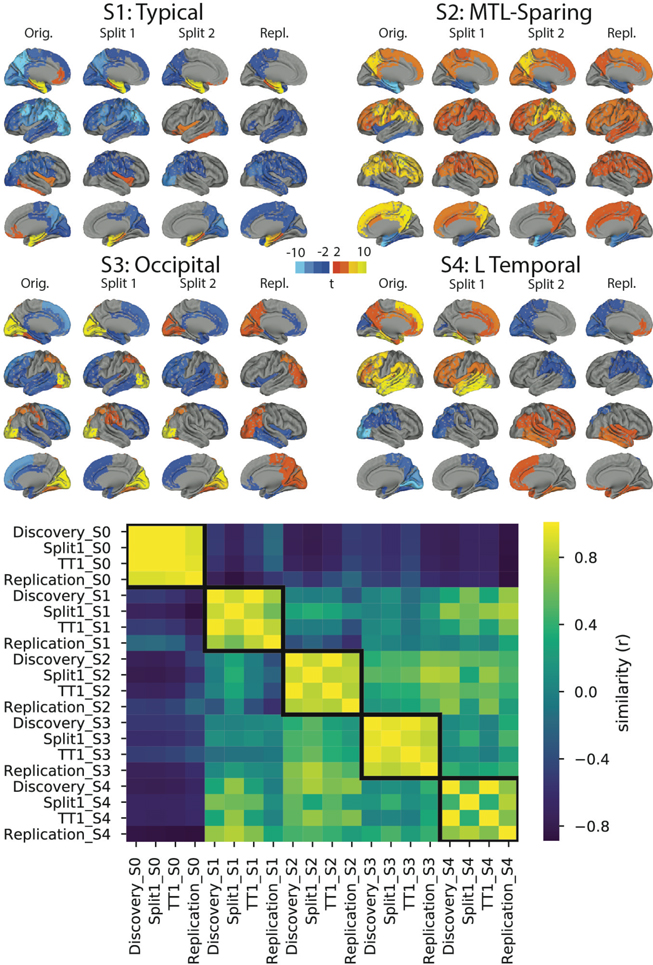
Figure S7.
Stability of subtypes across train-test split and replication datasets. (Top) Cortical renders showing, for each subtype across each dataset, regions with significantly different tau-PET signal compared to other within-dataset subtypes after FDR correction. Hot regions show greater tau-PET whereas cooler regions show lower signal. Remarkable similarity can be observed across subtypes, except S4, where lateralization switches from left to right. (Bottom) A heatmap showing similarity (spatial correlation) between subtypes across all four datasets. The diagonal represents the identity, whereas outlined boxes represent comparisons of the same subtype across cohorts.

