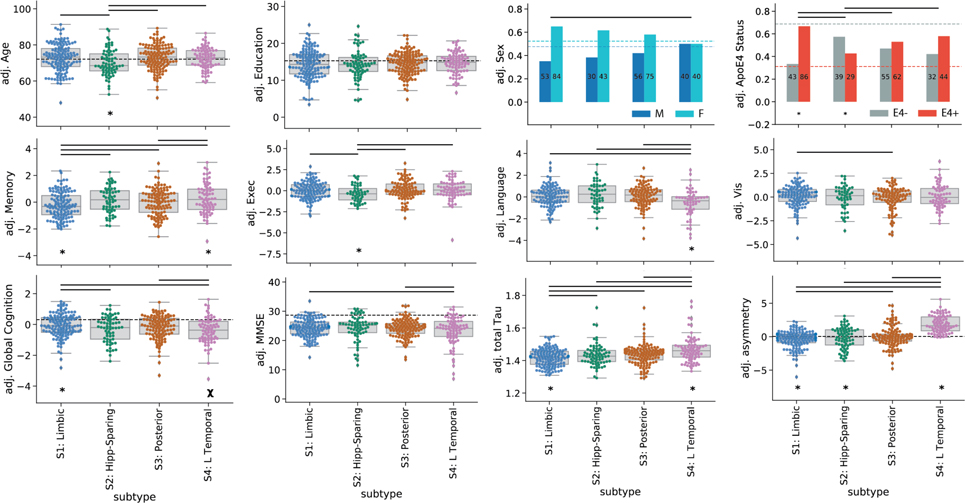
Figure S8.
Subtypes present with differing clinical profiles. For all plots, a * below a box indicates the subtype is significantly different (corrected p<0.05) from all other subtypes combined (one vs. all), while a χ represents a trend (p<0.1). Thick horizontal lines above boxes indicate significant (p<0.05) differences between two subtypes (one vs one). Dashed horizontal lines represent the mean of the S0 group (controlling for covariates), where relevant. All statistics are adjusted for demographics, disease status, cohort and SuStaIn stage. For boxplots, the center line=median, box=inner quartiles, whiskers=extent of data distribution except *=outliers

