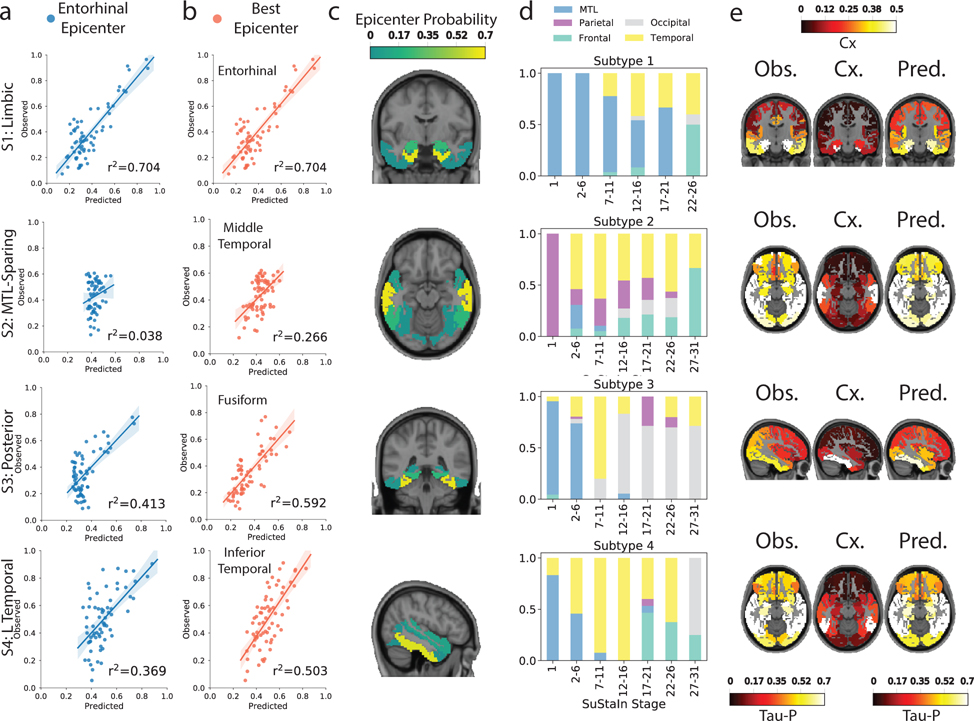
Figure 4.
Application of epidemic spreading model to determine subtype-specific corticolimbic circuit vulnerability. An epidemic spreading model was fit separately for each subtype; once using an entorhinal cortex epicenter (a, blue), and once with a subtype-specific best-fitting epicenter (b, red). For each plot, each dot represents a region. The x-axis represents the mean simulated tau-positive probabilities across the population, while the y-axis represents the mean observed tau-positive probability. Each row represents a subtype. Error bars in a-c represent 95% CI of model fit across 1000 bootstrap samples. c) For each subtype, the probability that each region is the best fitting epicenter for that subtype, based on bootstrap resampling. d) For each subtype, the proportion of individuals at various stages that had best-fitting epicenters within each of five major brain divisions: medial temporal lobe (MTL, blue), temporal lobe (yellow), parietal lobe (purple), occipital lobe (gray) and frontal lobe (turquoise). e) For each subype, spatial representation of ESM results from panel B using best-fitting epicenter. From left to right, observed regional tau-PET probabilities (tau-P), regional connectivity to best-fitting epicenter (Cx), tau-PET probabilities predicted by the ESM. These images show the degree to which constrained diffusion of signal through a connectome (Pred.), starting in a given epicenter and its associated fiber network (Cx.), recapitulates the tau patterns of each subtype (Obs.).

