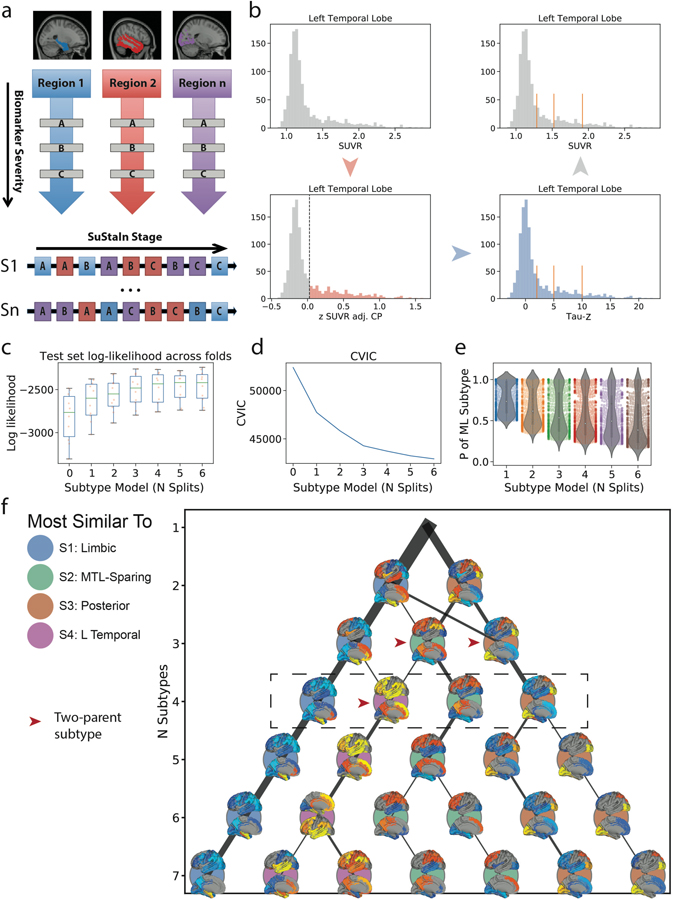
Figure S1.
Methodological details. a) SuStaIn requires both spatial (e.g. brain regions) and pseudotemporal (e.g. Z-score waypoints representing advancing biomarker severity) features as input. SuStaIn models linear change between waypoints across multiple biomarkers and uses k-means clustering to fit subtype trajectories representing distinct biomarker sequences. b) Each spatial feature was z-scored in order to derive interpretable waypoints. Example: (top left), SUVR distribution in the left temporal lobe. (bottom-left) Distribution of standardized residuals after regression of choroid plexus. Gaussian mixture-modeling identifies “normal” (grey) and “abnormal” (red) tau-PET values within this distribution. (bottom right) Mean and SD of “normal” distribution used to normalize the whole distribution, creating “Tau Z-scores”. Tau Z-scores of 2, 5 and 10 are used as waypoints. (top-right) Tau-z scores superimposed onto the original SUVR distribution. For each subtype model (k=1–7), distribution of average negative log-likelihood, d) CVIC, and e) distribution of the probability of the maximum-likelihood subtype across cross-validation folds of left-out individuals. Higher log-likelihood, lower CVIC represents better model fit. f) Visualization of subtype solutions k=2–7. For each subtype, the rendered brains show significant regional tau difference between the subtype and all other subtypes in its solution. Connecting-line thickness indicates how many subjects are shared between a subtype and each subtype from its parent and child solutions. Circle color represents of the k=4 subtypes (outlined in the dashed box) each subtype is most similar to, in terms of the number of overlapping subjects. Red arrowheads indicate subtypes that were formed by pooling individuals from two different parent subtypes.

