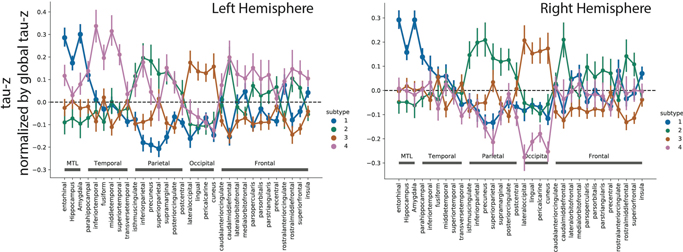
Figure S3.
Comparison of the mean tau-PET signal (tau-Z) across all ROIs, after adjustment for total cortical tau. A value of 0 represents a regional tau Z-score proportionate to the average cortical tau Z-score in that subtype. The left panel represents left hemisphere, the right panel represents right hemisphere. Confidence intervals represent standard error of the mean

