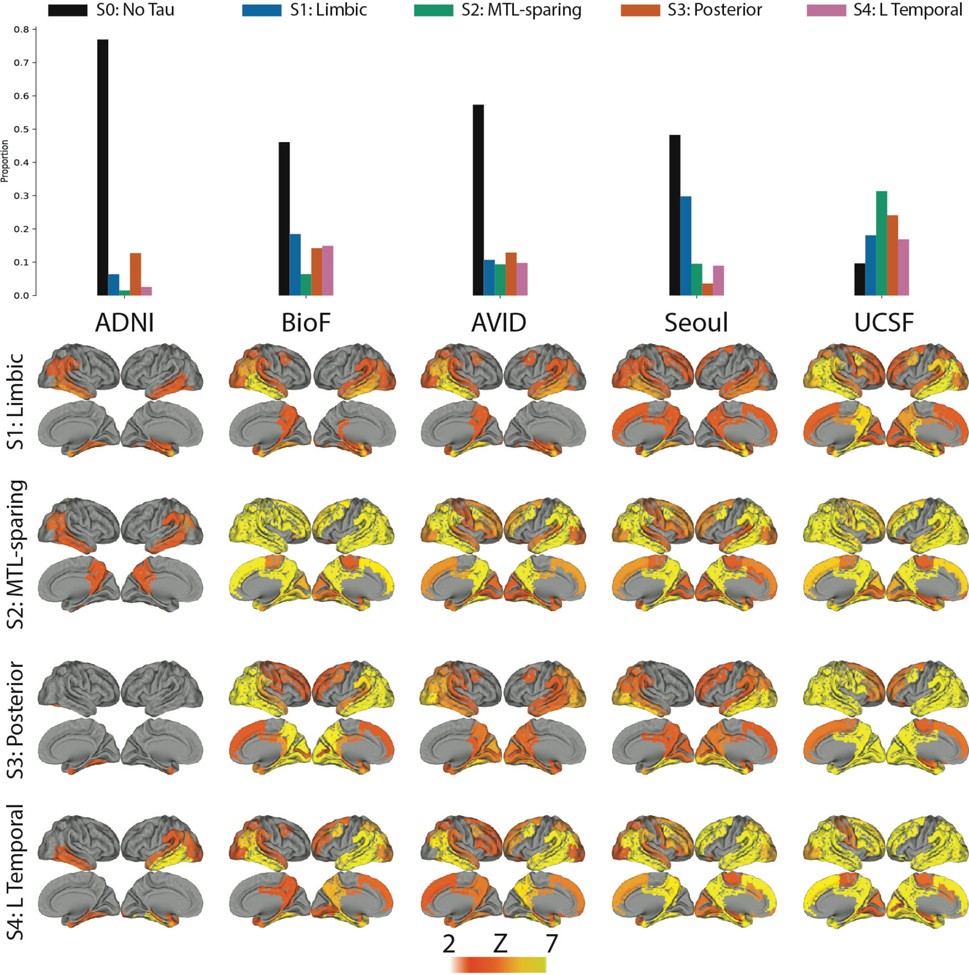
Figure S4.
All subtypes observable across all contributing cohorts. The top Figure shows the proportions of each subtype (plus S0) within each of the five cohorts. All cohorts included individuals from each subtype. The bottom shows the mean tau Z image of each subtypes in a given cohort. Variation can be observed across cohorts, particularly regarding phenotypic severity, but subtype patterns are fairly consistent.

