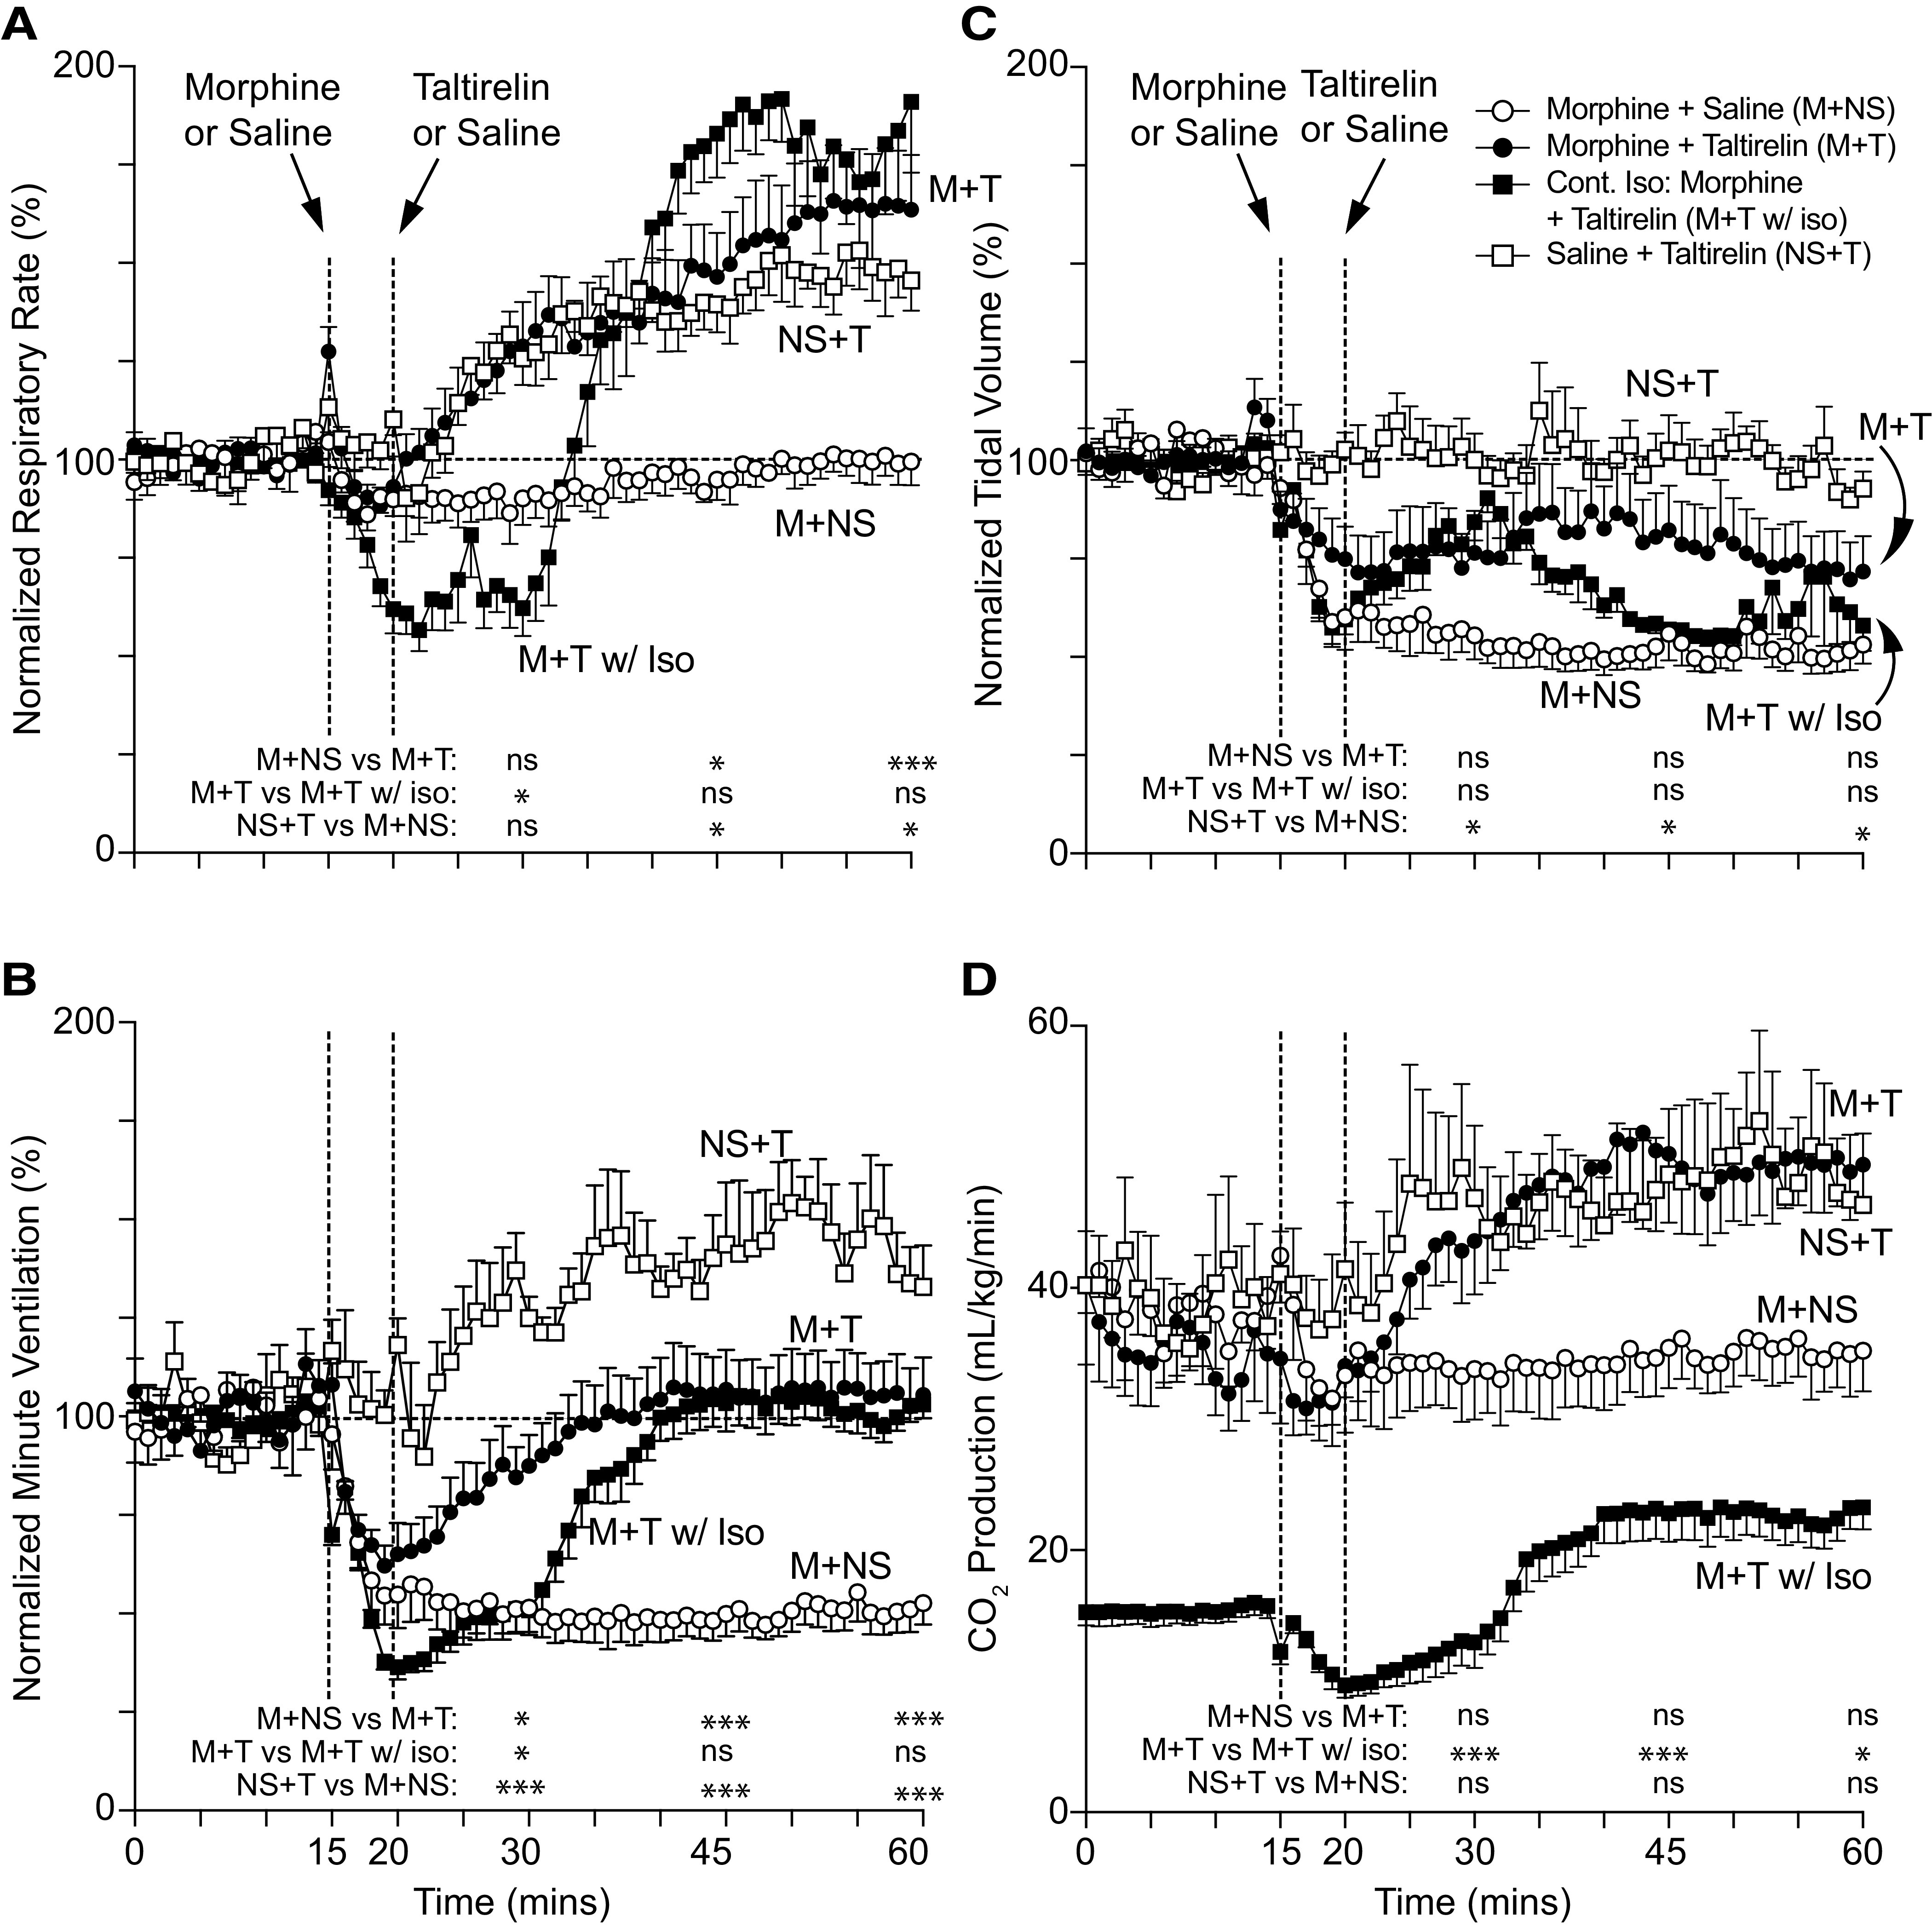
Fig. 1.

Rat breathing and CO2 production after morphine and taltirelin treatment with and without isoflurane anesthesia. Average respiratory rate (A), minute ventilation (B), tidal volume (C), and exhaled CO2 (D) as measured by nose-only plethysmography vs. time. Animals received 10 mg/kg i.v. morphine (M) over 5 minutes or 1 ml i.v. saline (NS) at 15 minutes followed by 1 mg/kg i.v. taltirelin (T) or 1 ml i.v. saline (NS) at 20 minutes; only one group received anesthesia with continuous 1.5% inhaled isoflurane (w/Iso) throughout. For each animal, data were normalized in (A) through (C) to 15 minutes of baseline data; each data point represents an average of 1 minute of data ± S.E.M.; n = 6–8 animals in (A) through (C) and n = 5–6 in (D). “ns” indicates no significance (P > 0.05); asterisks (∗ and ∗∗∗) indicate statistical significance (P < 0.05, P < 0.001, respectively) by one-way ANOVA test with a Sidak’s multiple comparisons post-test at data points 15, 30, or 45 minutes after first morphine or saline administration. For all conscious experiments, average respiratory rate (rate), minute ventilation (MV), tidal volume (TV), and CO2 production at baseline were 121 ± 4 breaths/min, 53 ± 3 ml/min/100 g, 0.44 ± 0.02 ml/100 g, and 42.6 ± 7.4 ml/kg/min, respectively; n = 21; n = 16 (CO2 production). For isoflurane-anesthetized animals, average respiratory rate, minute ventilation, tidal volume, and CO2 production at baseline were 71 ± 3 breaths/min, 33 ± 1 ml/min/100 g, 0.46 ± 0.02 ml/100 g, and 15.4 ± 0.9 ml/kg/min, respectively; n = 6.
