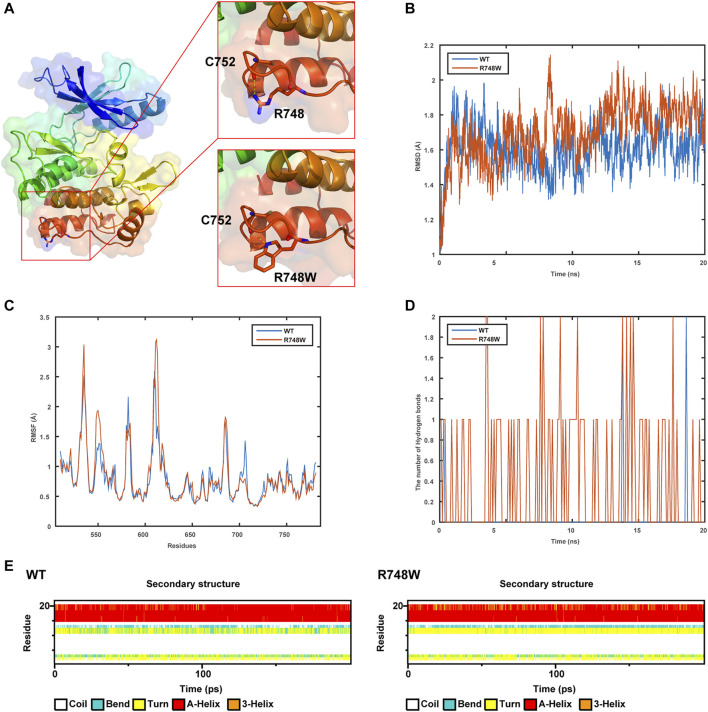
FIGURE 3.
Results of structure modeling and molecular dynamic simulation. (A) The structures of domain containing Arg748 (R748) or the Arg748Trp (R748W) mutant. Hydrogen bonds formed between the Arg748/Arg748Trp and Cys752 residues are shown in stick representation. The dotted yellow lines represent the hydrogen bonds involving Arg748. (B) The trajectory of RMSD (Cα) (root mean square deviation) of the two proteins. (C) RMSF (root mean square fluctuation) of the two proteins calculated from each simulation. (D) The number of hydrogen bonds formed between Arg748 (WT)/Arg748Trp (R748W)and the rest residues in the two protein models, respectively. (E) Secondary structural components of corresponding region in the two models (WT and R748W mutant) as a function of time.

